
Figure 3.
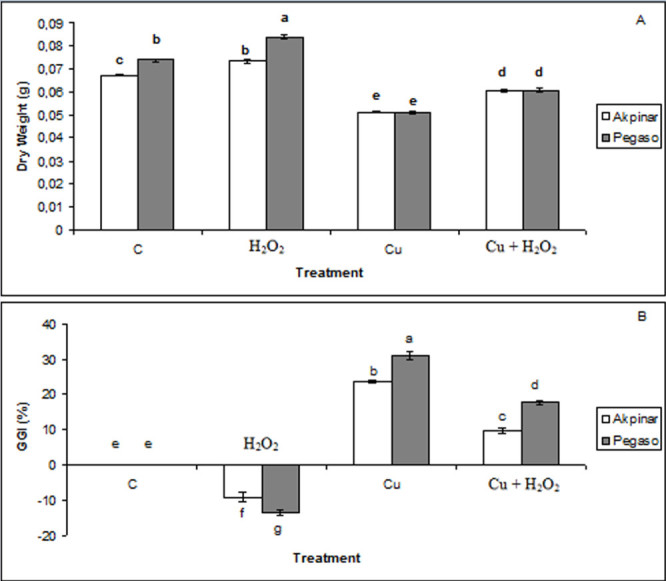
The effect of H2O2application on dry weight and GGI (%) under excess copper in maize cultivars. A and B represent dry weight and GGI (%), respectively. Vertical bars represent standard deviation. Different letters denote significant differences between the two cultivars along with different treatments at p < 0.05.