
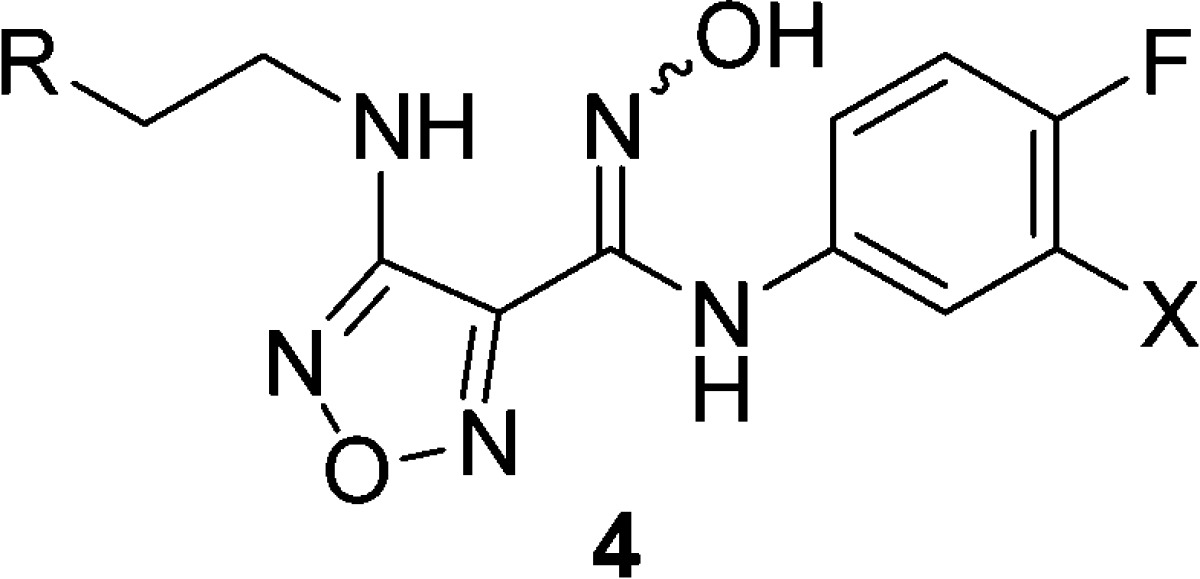
Table 2. Selected SAR of Amino-Furazan (4).
|
in vitro ADME |
calculated
propertiesb and ligand efficiency metrics |
||||||||||||||
|---|---|---|---|---|---|---|---|---|---|---|---|---|---|---|---|
| Cmpd | X | R | IDO IC50 (nM) | HeLa IC50 (nM) | P2 Cla | P1 + P2 Cla | Caco2 Pmc | FF (%)d | PSAe | cLogP | HBD | HBAf | MW | LEg | LLEg |
| 4a | Br | OMe | 200 | 100 | >2.2 | >2.2 | 44 | 0.9 | 100 | 2.7 | 3 | 8 | 374 | 0.45 | 4.3 |
| 4b | Br | OH | 170 | 22 | >2.2 | >2.2 | 31 | 2.3 | 111 | 1.8 | 4 | 8 | 360 | 0.51 | 5.8 |
| 4c | Br | NH2 | 290 | 98 | 1.1 | 0.9 | 1.8 | 6.1 | 117 | 2.0 | 5 | 8 | 359 | 0.47 | 5.0 |
| 4d | Br | NHAc | 210 | 17 | 0.9 | 2.0 | 19 | 4.4 | 120 | 1.9 | 4 | 9 | 401 | 0.45 | 5.9 |
| 4e | Br | NHSO2Me | 100 | 16 | 0.7 | 1.5 | 24 | 2.4 | 137 | 2.0 | 4 | 10 | 437 | 0.44 | 5.8 |
| 4f | Br | NHSO2NH2 | 73 | 7.4 | 0.4 | 0.7 | 4.0 | 3.1 | 163 | 1.5 | 6 | 11 | 438 | 0.46 | 6.6 |
| 4g | Cl | NHSO2NH2 | 120 | 11 | 0.5 | 0.8 | 4.3 | 3.8 | 163 | 1.4 | 6 | 11 | 394 | 0.45 | 6.6 |
a
Rat IntCl (L/h/kg). Rat hepatic blood flow = 3.3 L/h/kg.
b
ChemDraw Ultra 10.
c
Caco2 values Pm × (10)−6 cm/s.
d
Protein binding free fraction (FF).
e
PSA in Å2.
f
Total number of nitrogen (N) and oxygens (O).
g
Ligand efficiency (LE) and lipophilic ligand efficiency (LLE) calculated using HeLa pIC50.