
Figure 3.
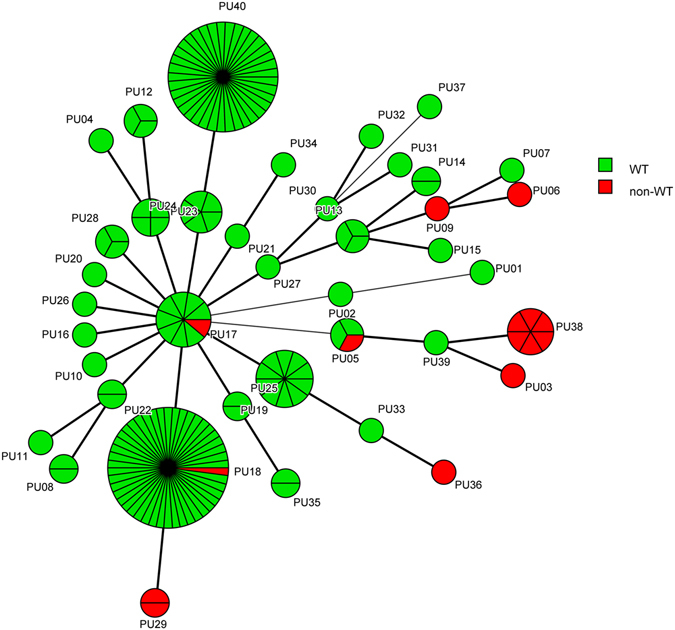
The association between microsatellite genotypes and antifungal susceptibility patterns of fluconazole of C. guilliermondii. Minimum spanning tree analysis based on the three loci of microsatellite data. Each circle corresponds to a microsatellite genotype. Different circle colors represent drug resistance pattern of fluconazole; Green, WT; Red, non-WT. The lines between circles indicate the similarity between profiles: bold line, 2 of 3 microsatellite loci in common; normal line, 1 locus in common.