Figure 2.

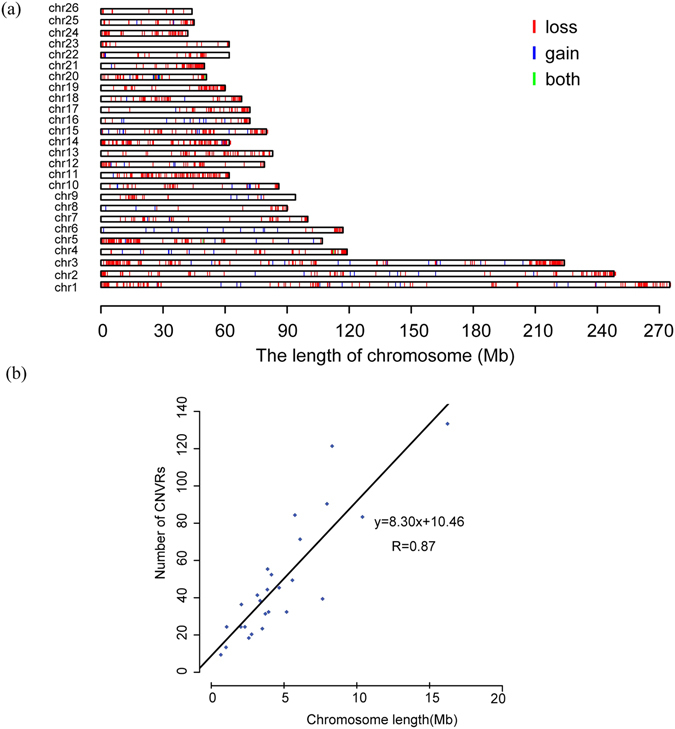
Genome-wide distribution of autosomal CNVRs in Tan sheep. (a) A map of CNVRs in the sheep genome; blue, green and red represent gain, loss and both (gain and loss), respectively. (b) Correlation between CNVR counts and chromosome length.

Genome-wide distribution of autosomal CNVRs in Tan sheep. (a) A map of CNVRs in the sheep genome; blue, green and red represent gain, loss and both (gain and loss), respectively. (b) Correlation between CNVR counts and chromosome length.