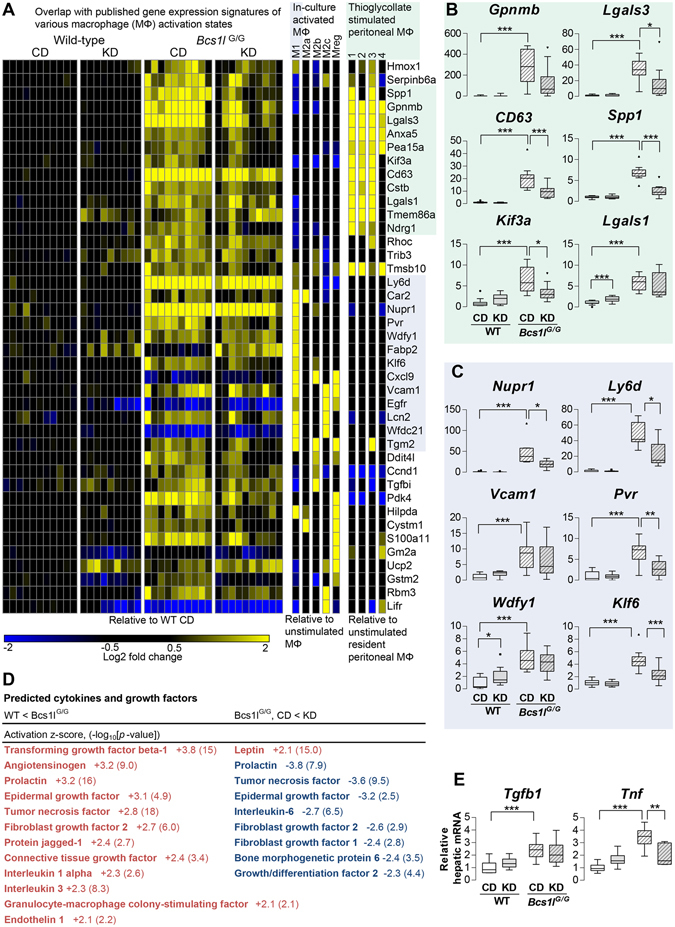
Figure 6.

Ketogenic diet modulates macrophage (MΦ) polarization-related gene expression signatures in Bcs1l G/G mice. (A) Liver transcriptomic data overlapping with published MΦ gene expression signatures. Expression profiles of in-culture stimulated mouse MΦ (induced from bone marrrow derived monocytes) were obtained from Gene expression omnibus (E-GEOD-32690)62. The macrophage populations are named as in the original work: M1, IFN-γ + LPS; M2a, IL-4; M2b, IFN-γ + complexed Ig; M2c, Dexamethasone; Mreg, IFN-γ. Expression profiles of four thioglycollate stimulated mouse peritoneal MΦ populations (flow cytometry sorted for CD115pos, MHC-II, F4/80, SiglecFneg and CD11cpos) were extracted from microarray dataset GSE1590. Liver transcriptome data was filtered for q < 0.1 and DESeq2 adjusted fold change > 3 in any of the three pair-wise comparison (WT on CD vs KD, WT on CD vs Bcs1l G/G on CD and Bcs1l G/G on CD vs KD). MΦ datasets were filtered with the same criteria except that only up-regulated genes were included. (B) The most highly up-regulated genes overlapping with the profile of thioglycollate stimulated peritoneal MΦ. (C) The most highly up-regulated genes overlapping with the profile of M1-type MΦ. (D) Ingenuity Upstream Regulator Analysis for cytokines and growth factors predicted to drive observed gene expression changes. (E) Hepatic expression of transforming growth factor beta-1 (Tgfb1) and tumor necrosis factor (Tnf) as measured by qPCR. In the box plots n = 9–11/group except for Tnf for which n = 6–8/group. The box plot whiskers represent minimum and maximum values within the 1.5 interquartile range. *p < 0.05, **p < 0.01, ***p < 0.001.
