
Figure 7.
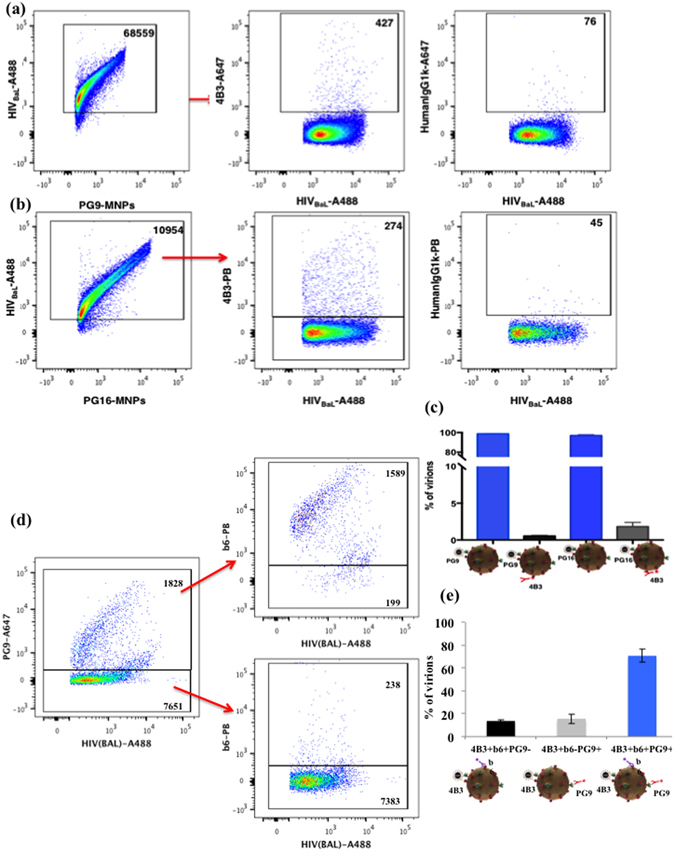
Flow virometry of fluorescence-labeled HIV-1BaL virions. (a) Alexa Fluor 488 -labeled virions were captured with PG9-MNPs (left panel) and stained with AlexaFluor 647 4B3 antibodies for the presence of stumps/uncleaved Envs (center panel) or with AlexaFluor 647-labeled isotype control antibodies (right panel). Indicated are the numbers of events. A representative experiment out of three is shown. (b) Alexa Fluor 488 -labeled virions were captured with PG16-MNPs (left panel) and stained with Pacific Blue-labeled 4B3 antibodies for the presence of stumps (center panel) or with Pacific Blue-labeled isotype control antibodies (right panel). Indicated are the numbers of events. A representative experiment out of three is shown. (c) Fractions of PG9-MNPs and PG16-MNPs captured Alexa Fluor 488 virions positive for 4B3. Each bar represents mean ± SEM of three experiments. (d) Alexa Fluor 488 -labeled virions were captured with 4B3-MNPs and stained with two antibodies: AlexaFluor 647-labeled PG9 and Pacific Blue-labeled b6. Left panel: Virions were captured with 4B3-MNPs and stained with PG9. Upper right panel: 4B3-MNP-captured virions positive for PG9 and stained with b6. Lower right panel: 4B3-MNP-captured virions negative for PG9 and stained with b6. Indicated are the numbers of events. A representative experiment out of three is shown. (e) Distribution of 4B3-MNPs–captured Alexa Fluor 488 labeled virions stained with two antibodies: AlexaFluor 647-labeled PG9 and Pacific Blue-labeled 4B3. Each bar represents mean ± SEM of three experiments.