Figure 2.

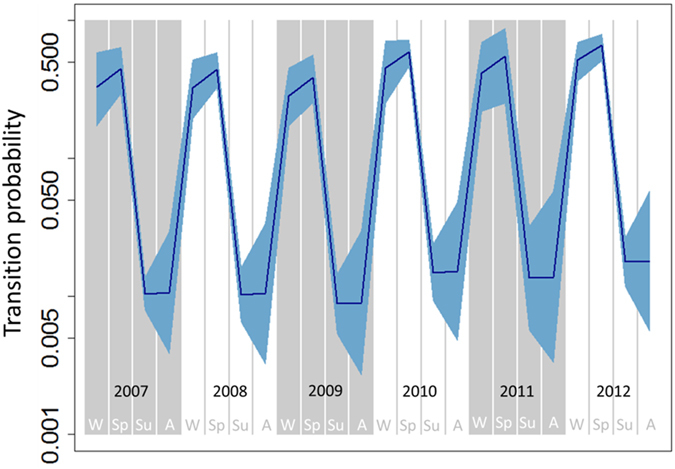
Temporal dynamic of the probability that an uninfected badger becomes infected between two capture sessions. Blue shading indicates 95% confidence intervals. The y-axis is on the log-scale. W: winter; Sp: spring; Su: summer; A: Autumn.

Temporal dynamic of the probability that an uninfected badger becomes infected between two capture sessions. Blue shading indicates 95% confidence intervals. The y-axis is on the log-scale. W: winter; Sp: spring; Su: summer; A: Autumn.