
Figure 3.
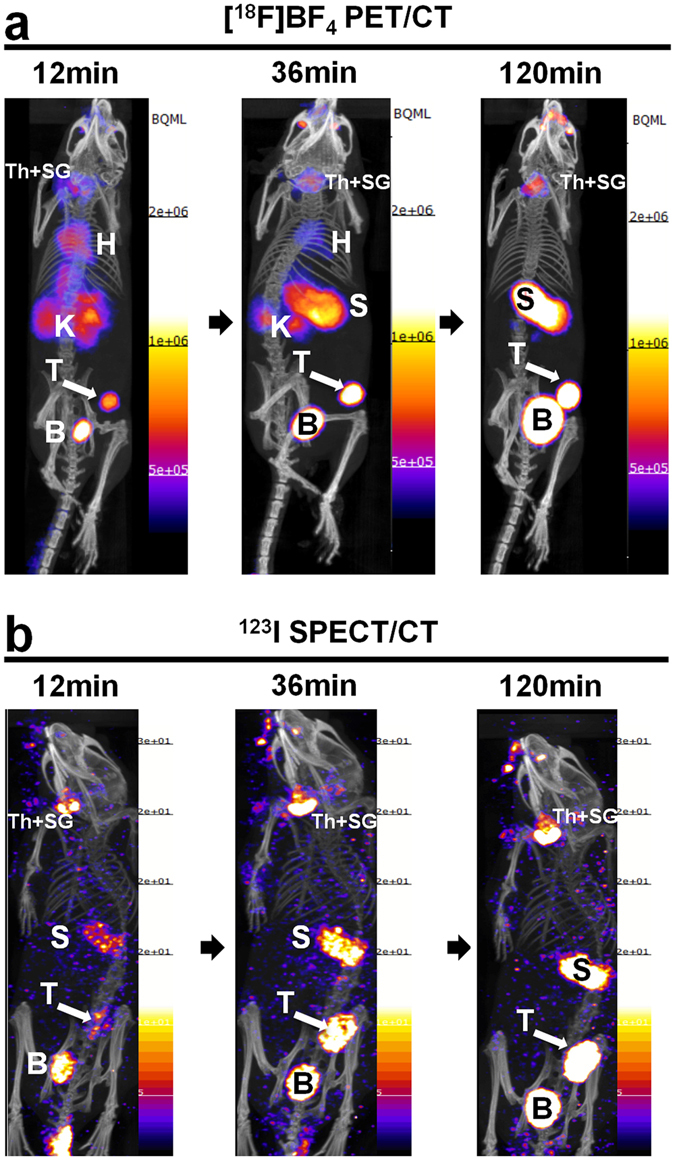
Comparative in vivo NIS imaging indicates differences between the PET tracer [18F]BF4 − and the SPECT tracer [123I]iodide. Tumors were established as in Fig. 2 but grown to sizes of ~350 mm3 (see Supplementary Fig. S2B) before being imaged by either [18F]BF4 −-PET (a) or [123I]iodide-SPECT (b). Dynamic PET data were binned into time intervals comparable to sequential SPECT images (see Materials and Methods). Al images are maximum intensity projections overlaid on CT. Abbreviations are: bladder (B), heart (H), kidney (K), stomach (S), thyroid and salivary glands (Th + SG), and primary tumor (T). Representative images of cohorts of N = 3 are shown.