
Figure 4.
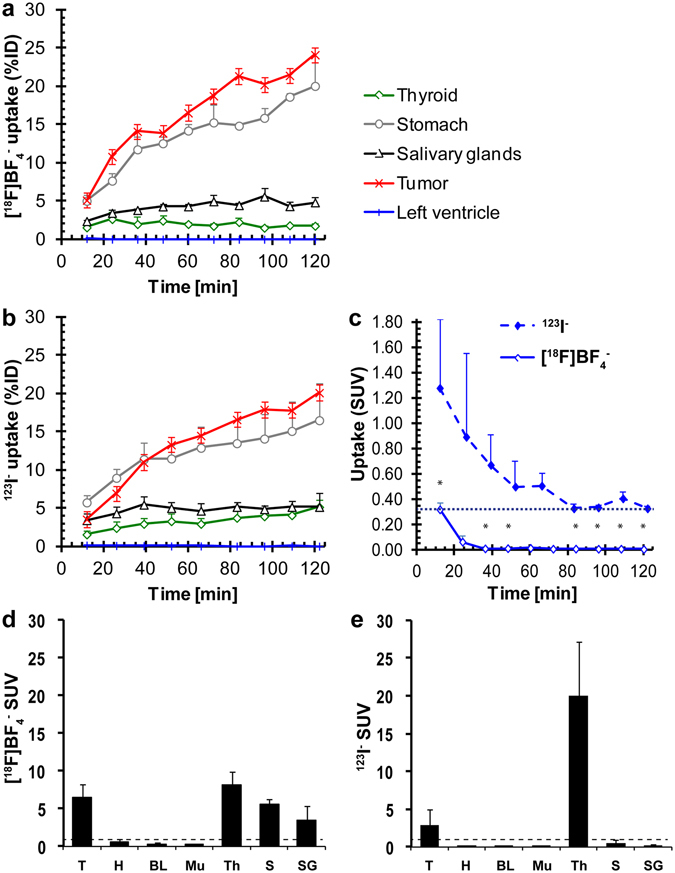
Quantitative analysis of in vivo NIS imaging and ex vivo biodistribution data reveals differences in pharmacokinetics between the PET tracer [18F]BF4 − and the SPECT tracer [123I]iodide. (a/b) Image data analysis of (a) dynamic [18F]BF4 −-PET and (b) sequential [123I]iodide-SPECT experiments was performed as described in Materials and Methods. Cumulative data of organs expressing exogenous human NIS (primary tumor, red) and expressing endogenous NIS (thyroid, green; salivary glands, black; stomach, grey) are shown for each tracer. A heart volume comprising of the left ventricle was used as a surrogate for the blood pool (blue). Tracer batches were identical for all animals and experiments performed on the same day (N = 3 animals for each tracer). (c) A more detailed view of the radioactivity time course in the left ventricle (surrogate for the blood pool in vivo). It demonstrates the faster and more complete clearance of [18F]BF4 − as compared to [123I]iodide. (d/e) Ex vivo radioactivity analysis by γ-counting of harvested tissues was performed subsequent to imaging. Cumulative SUV data of all experimental animals of the [18F]BF4 − (d) and [123I]iodide (e) cohorts (N = 5 each). Abbreviations are (from left to right): primary tumors (T), heart (H), blood (BL), muscle (Mu), thyroid (Th), stomach (S), and salivary glands (SG). Error bars in all panels represent SD.