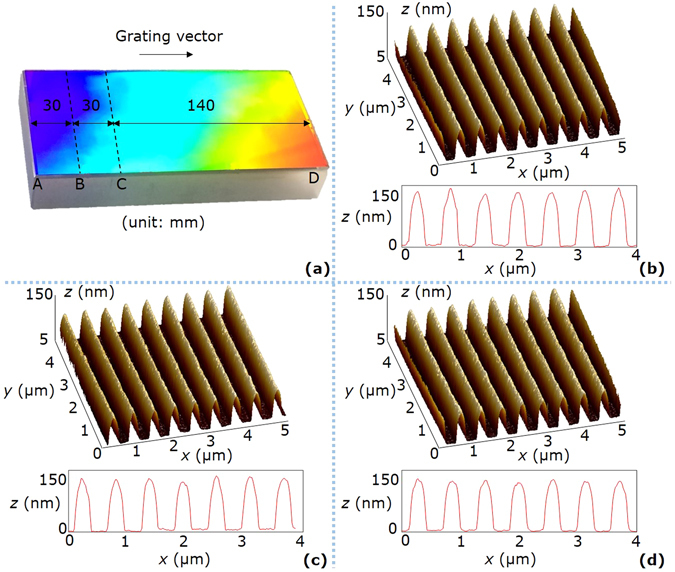
Figure 6.

Photograph and AFM images of the grating with a photoresist thickness of 150 nm. (a) Photograph of the grating. AB is the stationary exposure area of a size 30 mm × 100 mm, BC is the linear exposure area of a size 30 mm × 100 mm, and CD is the scanning exposure area of a size 140 mm × 100 mm. (b) AFM image of the sample point on the area AB. The average (AVE) and standard deviation (STD) of the duty cycles are respectively 0.41 and 0.02. (c) AFM image of the sample point on the area BC. The AVE and STD of the duty cycles are respectively 0.40 and 0.02. (d) AFM image of the sample point on the area CD. The AVE and STD of the duty cycles are respectively 0.41 and 0.01. For (b–d), the measurement area is 5 μm × 5 μm, and the groove structures in the mid-line of the measurement area are shown at the bottom of each sub-figure.
