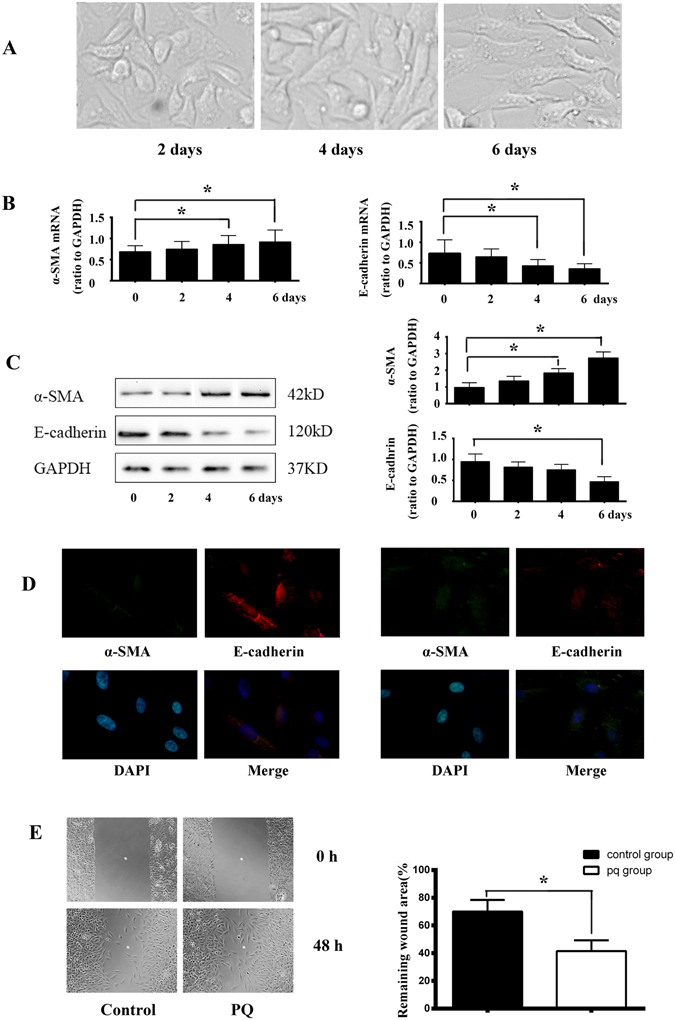
Figure 1.

PQ induced EMT-like phenotypic changes in A549 cells. (A) Morphological changes of A549 cells induced by PQ exposure (300 μmol/L) at different time points. After exposure to PQ, the cells gradually displayed morphological appearances of mesenchymal cells and after 6 days of PQ exposure, the majority of cells became spindle-shaped. (B) Quantitative RT-PCR analysis result of α-SMA and E-cadherin mRNA in A549 cells after exposure to PQ at indicated time points. PQ treatment induced increasing of mRNA of α-SMA and decreasing of E-cadherin after 4 days of exposure. The qRT-PCR results shown represent an average of three independent experiments. (C) Alterations of α-SMA and E-cadherin proteins expression in PQ treated A549 cells in serials of time by Western blot analysis. A dramatic decrease of E-cadherin protein was detected on the 6th days and an increase of α-SMA protein level on the 4th day after PQ exposure. Representative blots from three independent experiments are shown. Density of α-SMA and E-cadherin were quantified and expressed as the ratio to GAPDH. (D) Increased cell membrane distribution ofα-SMAprotein and decreased E-cadherin proteininA549cells in respond to PQ stimulation as assessed by immunofluorescent staining. α-SMA was stained green, E-cadherin was stained red and DAPI stained nuclei blue. (E) A significantly increased migration capacity after PQ exposure by about 0.41 fold was calculated than that of normal A549 cellsby monolayer wound-healing assay. *p < 0.05.
