Figure 2.

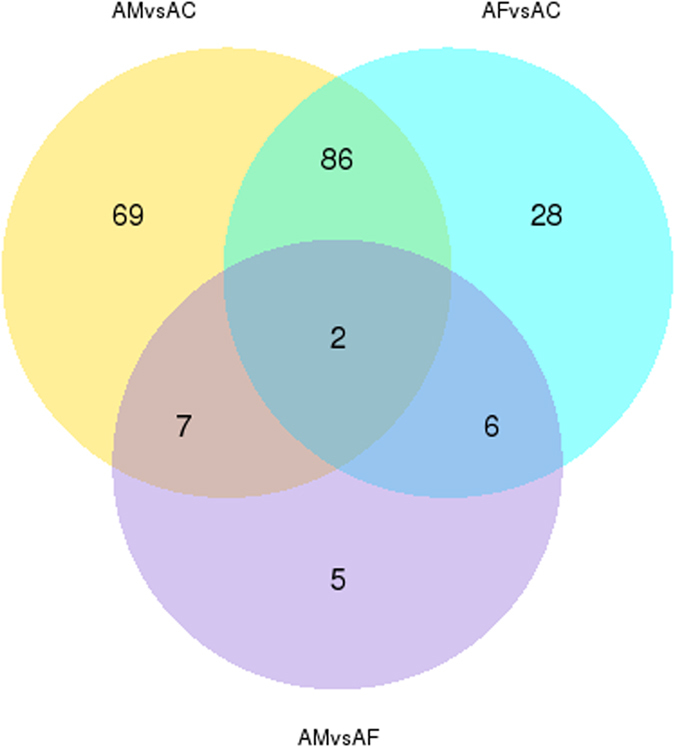
Venn diagram visualizing the number of differential expressed genes for treatments of M. anisopliae (AM), F. axysporum (AF) or control (AC). (The numbers of shared DEGs are indicated in the overlapping parts of the circles).

Venn diagram visualizing the number of differential expressed genes for treatments of M. anisopliae (AM), F. axysporum (AF) or control (AC). (The numbers of shared DEGs are indicated in the overlapping parts of the circles).