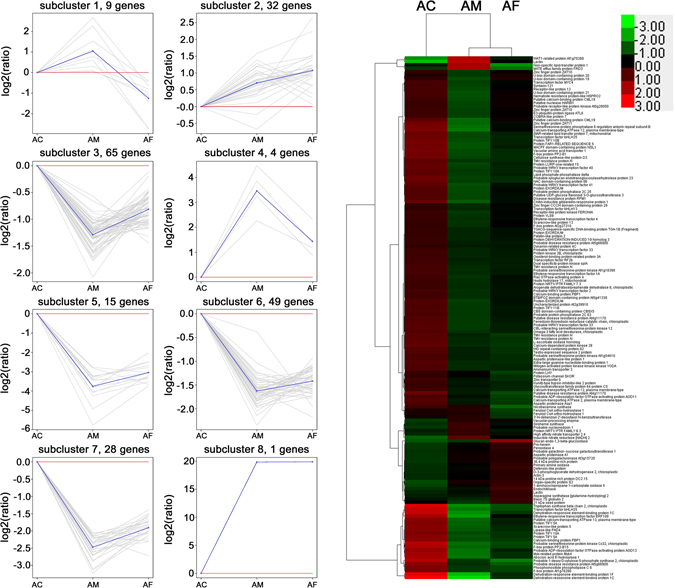
Figure 3.

Cluster analysis of DEGs identified by Transcriptome comparisons of M. anisopliae treatment (AM), F. axysporum treatment (AF) and control (AC). Right: Heatmap of DEGs across the three treatments. Red indicates high expression and green indicates low expression. Chroma color from red to green indicates log10 (FPKM + 1) from more to less. Left: Expression patterns of the genes in the eight main clusters corresponding to the heatmap. Gray lines represent relative expression of a gene cluster under different experimental conditions, the blue line represents the average of the relative expression of all the genes in the cluster. Y-axis shows the Log2 (ratios) relative expression levels.
