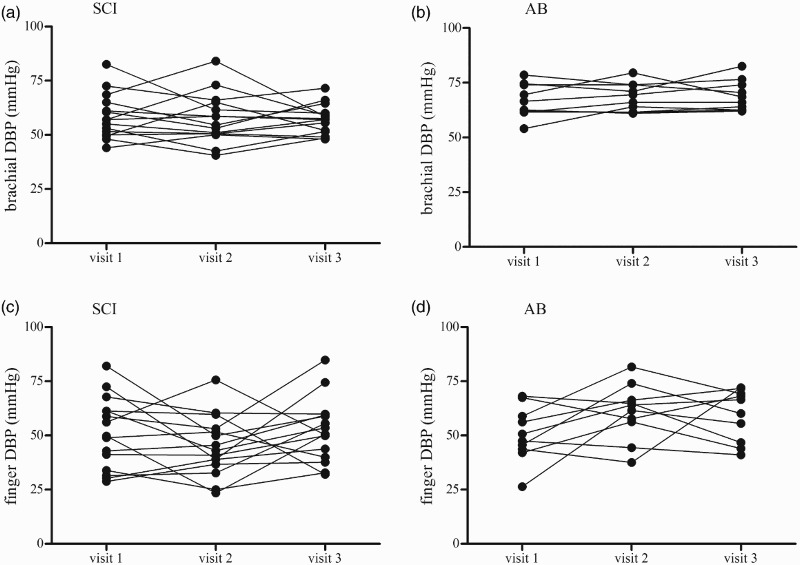
Figure 4.

Depicts inter-day (visit) variability in DBP at the brachial artery in the SCI (4A) and AB (4B) participants and at the finger in the SCI (4C) and AB (4D) participants. Data reflect the mean of two measurements taken 15 minutes apart on each study visit.
