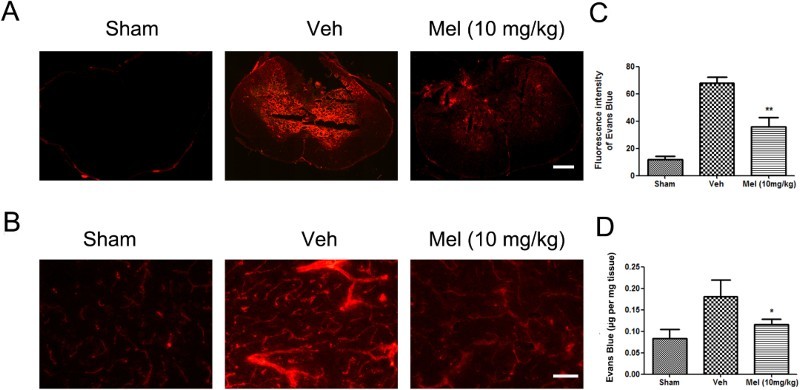
Figure 2.

The effect of melatonin on the permeability of the blood–spinal cord barrier (BSCB) following SCI. (A-B) Representative fluorescent image of an Evan's Blue dye extravasation at the spinal parenchyma at 7 days after SCI, in an entire spinal cord transverse section, and in the ventral horn of the spinal cord (n = 6). Scale bar = 50μm. (C) Quantification of the fluorescence intensity of Evan's Blue. (D) Quantification of the amount of Evan's Blue. *P < 0.05 in Veh versus Mel (10 mg/kg), **P < 0.01 in Veh versus Mel (10 mg/kg) (Colour online)
(sham group: Sham; vehicle group: Veh; melatonin group: Mel (10 mg/kg))
