Figure 3.

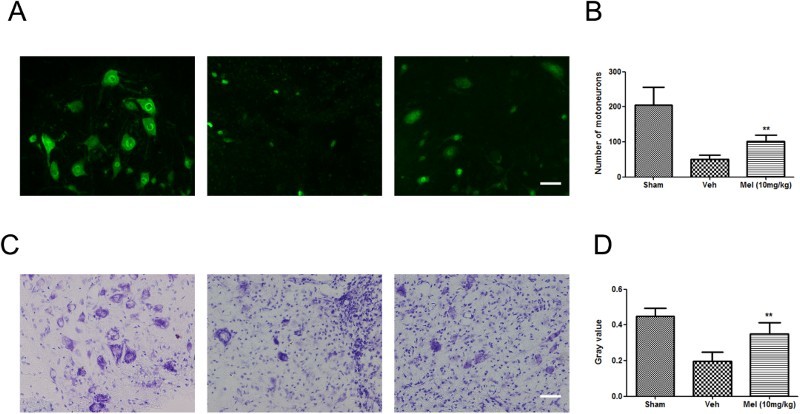
The effect of melatonin on neurons following SCI. (A) NeuN positive neurons were detected in the different treatment groups by immunofluorescence (n = 4). (B) Quantification of NeuN positive neuron cell bodies in the T10 region across groups. (C) Spinal cord transection showed Nissl substance in the control and treated groups by cresyl violet staining (n = 4). (D) Gray value of Nissl body was analyzed across groups. **P < 0.01 in Veh versus Mel (10 mg/kg). Scale bar = 50 μm. (Colour online)
(sham group: Sham; vehicle group: Veh; melatonin group: Mel (10 mg/kg))
