Figure 3.

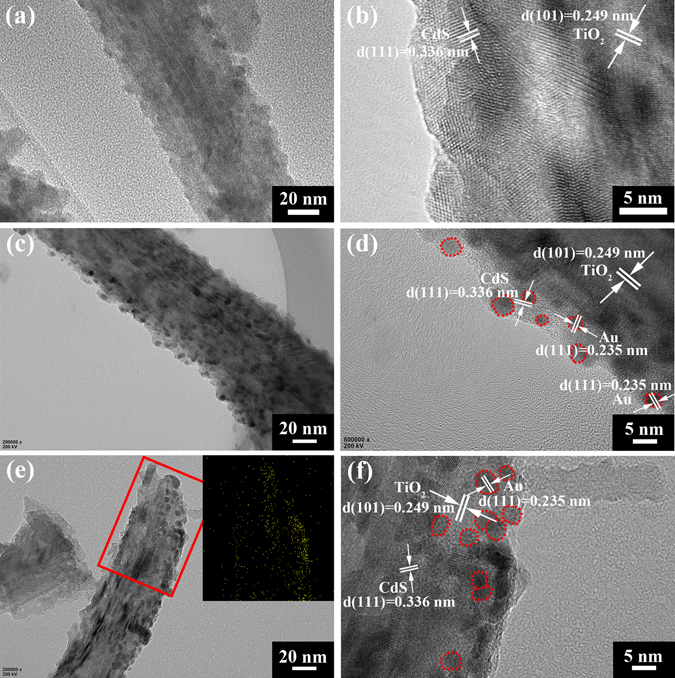
TEM images of TiO2 NRAs/CdS/Au: (a and b) 0 s, (c and d) 30 s, (e and f) 60 s. The inset of (e) is the distribution of Au NPs corresponding to the region marked by the red rectangle. Au NPs are marked by red circles in (d and f).

TEM images of TiO2 NRAs/CdS/Au: (a and b) 0 s, (c and d) 30 s, (e and f) 60 s. The inset of (e) is the distribution of Au NPs corresponding to the region marked by the red rectangle. Au NPs are marked by red circles in (d and f).