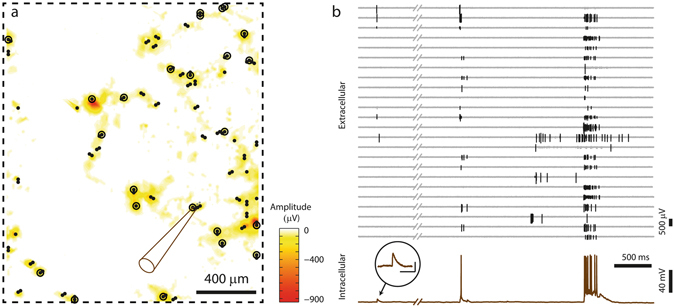
Figure 3.

Simultaneous recording of network activity and intracellular activity. (a) Visualization of the array area (dashed box), and the corresponding SSAM. A neuron (position indicated by pipette drawing) was recorded intracellularly, while spontaneous extracellular activity was recorded by sparsely distributed electrodes (all recording electrodes are marked with black spots, while circled dots indicate the subset of electrodes, the signals of which are shown in (b)). (b) Top: Extracellular signals (detected spikes) of 24 electrodes distributed over the array at the locations of the circled dots in (a). Bottom: Intracellular signal of the patched neuron. The close-up shows an individual, enlarged PSP (scale bars 100 ms/4 mV).
