Figure 4.

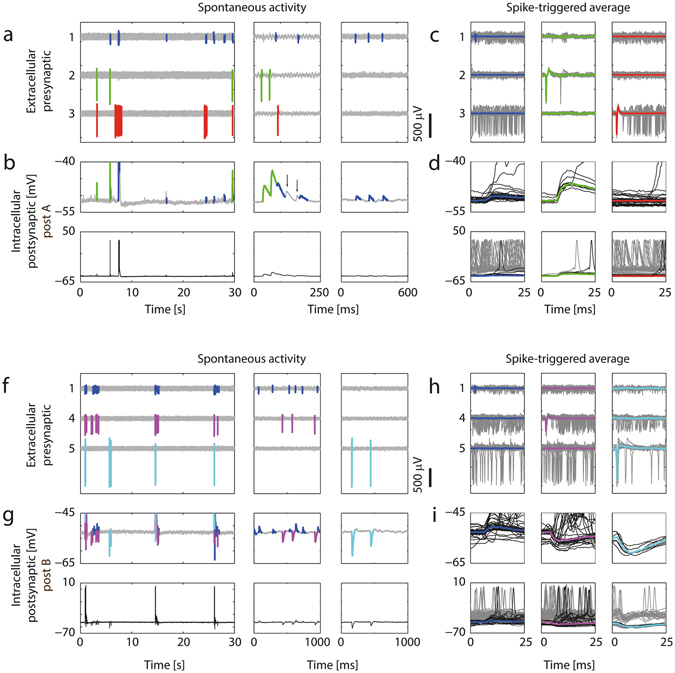
Mapping excitatory and inhibitory PSPs based on recordings of spontaneous activity. (a) Three data segments with different time scales (left, center, right) of recorded extracellular data from 3 electrodes. Spikes from 3 sorted neuronal units were colored; the blue and the green neuron were found to be presynaptically connected to the patched neuron ‘post A’, while the red neuron was not. (b) Top: Intracellular recordings from the patched cell. The signal trace after spikes of the blue and green neuron was colored in order to visualize excitatory PSPs originating from these two neurons, as determined by PSP averaging in (d). Note the summation of the synaptic events in the center plot, and that two additional EPSPs were measured, which, however, were not correlated to activity of the blue or green neurons (black arrows). Bottom: The same signal displayed with a larger amplitude range so that also postsynaptic APs can be seen. (c) STA of the extracellular APs extracted from a total of 2.5 minutes of recorded data (individual traces: gray; averaged waveforms are colored). (d) Top: Intracellular postsynaptic traces for the spikes of the colored neurons. Only traces that started from a baseline membrane potential (MP) value (i.e., did not exceed −48 mV during the first 5 ms) are shown here. Note that the blue and the green neurons evoked EPSPs of different magnitude, and that no PSPs were seen following APs of the red neuron. The colored waveforms show the median MP trace. Bottom: The same traces on a wider MP range. Additionally, traces which were recorded at depolarized state (MP more positive than −48 mV during the first 5 ms) are plotted in gray. (f–i) Equivalent plots for postsynaptic neuron B. In this example the violet and the cyan neurons evoked inhibitory PSPs (IPSPs) of different magnitudes, whereas the blue neuron evoked EPSPs. Note that the blue presynaptic neuron is the same than the one for ‘post A’ in Fig. 4(a–d). Spikes in h were extracted from 6 minutes of recorded data.
