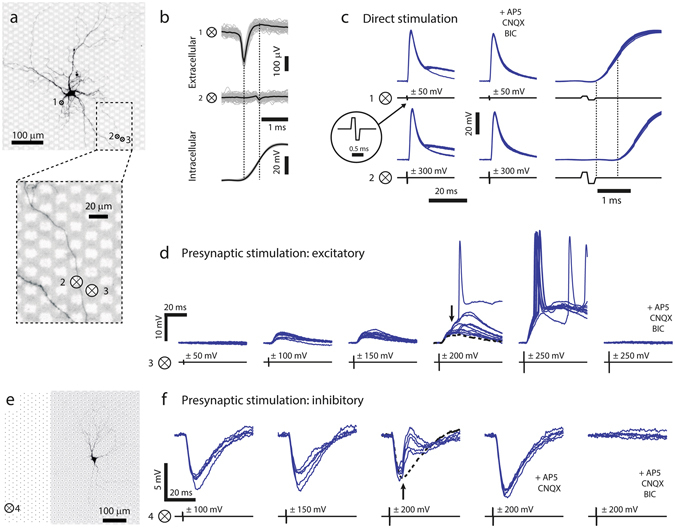
Figure 6.

Evoking postsynaptic signals through HD-MEA electrical stimulation. (a) Fluorescence image of a neuron patched on the array, the numbered crosses inside circles “⊗” indicate positions of stimulating and/or recording electrodes. The magnified part at the bottom shows that a neuronal process is situated on top of electrode 2. (b–e) Numbered ⊗ correspond to the electrodes indicated in a. (b) STA extracellular traces (gray) and average trace (black), measured at electrodes 1 and 2 (top) and intracellularly measured AP (bottom). Note differences in spike shape and the temporal delay between the waveforms at electrodes 1 and 2. (c) Left: Intracellular responses (blue traces, 10 trials each) to extracellular stimulation at electrodes 1 and 2 under control conditions. The stimulus timing is indicated by the black traces, and the inset shows a single biphasic voltage pulse. All stimuli evoked APs, some stimulation trials also evoked PSPs, which overlapped with the APs. Center: Responses in the presence of synaptic blockers, where no PSPs were evoked. Right: Zoom-in on responses under control conditions to better visualize the delay between stimulus end and AP onsets (depicted by the dashed lines). Also note the difference in stimulus amplitude required to elicit an action potential through electrodes 1 and 2. (d) Stimulation with voltage pulses of increasing amplitudes. APs of a presynaptic neuron were evoked with stimulation voltages of ±100 and ±150 mV leading to PSPs. Increasing the voltage to ±200 mV resulted in additional PSPs for some trials (indicated by the black arrow, the dashed black line represents the median response for ±150 mV pulses). Yet larger PSPs were seen for ±250 mV, along with the occurrence of postsynaptic APs in most of the trials. Addition of synaptic blockers resulted in complete blockade of evoked signals, indicating that all observed responses involved synaptic transmission. (e) Fluorescence image of another neuron and position of the stimulation electrode 4. Black dots represent the positions of MEA electrodes. (f) PSPs upon stimulating an inhibitory presynaptic neuron were evoked by applying ±100 and ±150 mV at electrode 4. An additional excitatory presynaptic neuron was evoked upon increasing the extracellular stimulus at electrode 4 to ±200 mV (black arrow, black dashed line represents the median response for ±150 mV). Application of excitatory blockers blocked the EPSPs at ±200 mV, whereas additional application of BIC completely blocked all responses.
