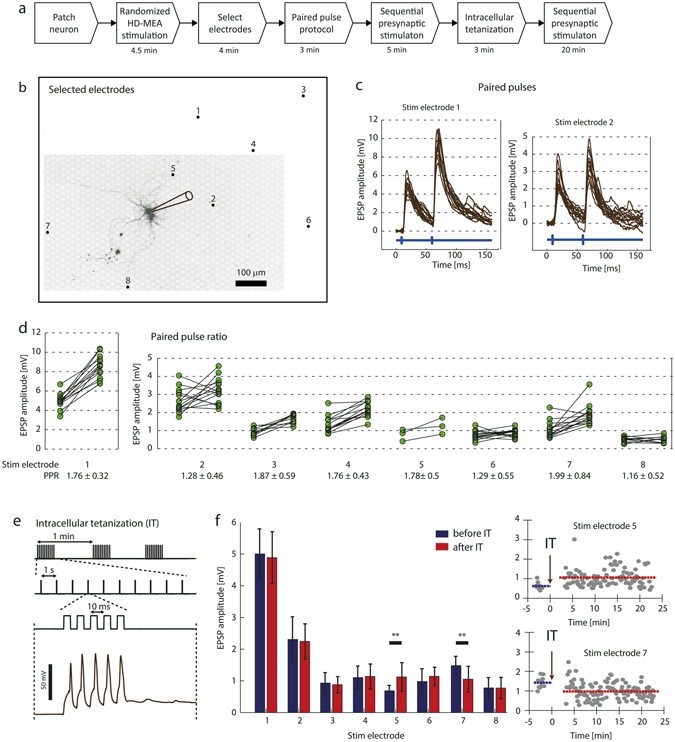
Figure 8.

Short- and long-term plasticity measurements for multiple synaptic inputs. (a) Experimental steps. (b) Fluorescence image of a patched neuron (indicated by the pipette drawing) and position of eight electrodes, which were found to evoke PSPs at the patched cell. (c) Individual intracellular traces during application of paired-pulse stimulation through SE 1 and SE 2 (14 trials each). The blue signal at the bottom visualizes the timing of the extracellular stimulation. (d) Every connected pair of dots displays the PSP amplitude values for the first and the second evoked PSP upon application of a paired-pulse protocol. If the postsynaptic neuron depolarized before the second PSP peak occurred, the PSP values could not be measured and the trial was ignored for the Figure and PPR calculation. (e) Top: Current stimulus used for the intracellular tetanization protocol as described in Methods, consisting of three trains with 10 individual bursts while each burst included five current pulses (0.9 mA amplitude, 5 ms duration) evoking individual APs. Bottom: Five APs evoked by a burst. (f) Left: Average PSP amplitudes before and after IT and the corresponding standard deviations indicated by error bars. Right: Individual measured PSP values over the course of the IT experiment for SE 5 and SE 7. The blue and red lines visualize the average PSP amplitude before and after IT.
