
Figure 3.
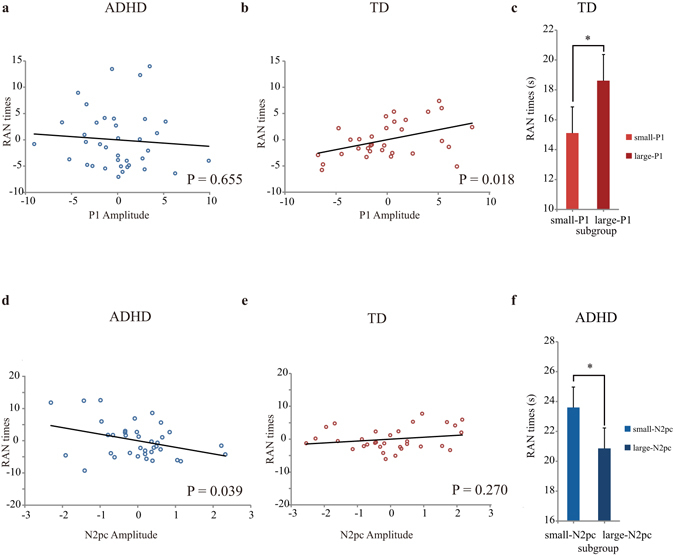
Scatter plots depict regression results between P1 amplitude and RAN times in children with ADHD (a) and TD children (b) after controlling for age and IQ. The schematic illustration in (c) shows mean times (and SE) of RAN for small-P1 and large-P1 subgroups for TD children. Scatter plots depict regression results between target-elicited N2pc amplitude and RAN times in children with ADHD (d) and TD children (e) after controlling for age, IQ and N2pc latency. The schematic illustration in (f) shows mean times (and SE) of RAN for small-N2pc and large-N2pc subgroups for children with ADHD.