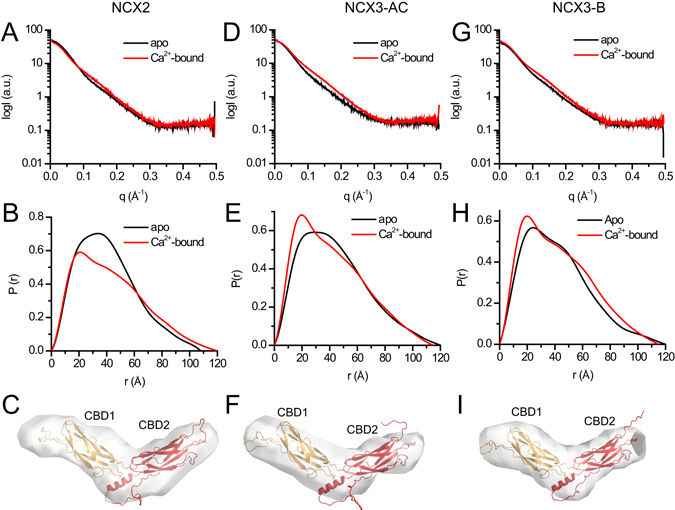
Figure 2.

Ab-initio modelling of CBD12 from NCX2 and NCX3. (A,D,G) Experimental SAXS curves of CBD12 from NCX2 (A), NCX3-AC (D), and NCX3-B (G) in the presence (red) and absence (black) of Ca2+. (B,E,H) Paired-distance distribution functions of CBD12 from NCX2 (B), NCX3-AC (E), and NCX3-B (H) in the presence (red) and absence (black) of Ca2+ as determined using GNOM. (C,F,I) Ab-initio model of CBD12 from NCX2 (C), NCX3-C (F), and NCX3-B (I) in solution in the presence of Ca2+. The homology model of CBD12 was fit into the molecular envelope using SUPCOMB. CBD1 and CBD2 are presented as orange and red cartoons, respectively.
