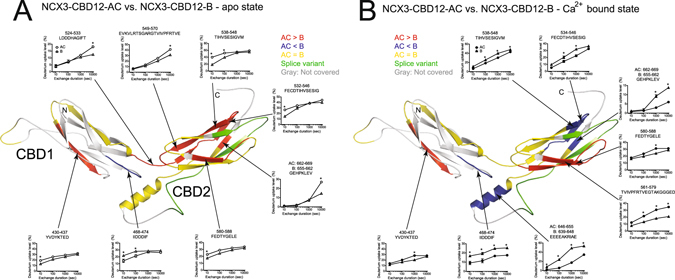
Figure 4.

Effect of alternative splicing on the conformational dynamics of NCX3-CBD12. Deuterium uptake differences between NCX3-AC and NCX3-B in the apo form (A) or in the Ca2+-bound form (B) are color-coded onto the model of NCX3-AC. Regions with similar deuterium uptake are yellow, regions with higher deuterium uptake in NCX3-AC are red, and regions with higher deuterium uptake in NCX3-B are blue. The alternative splicing region is in green and regions not covered by the detected peptic peptides are in gray. The uptake plots of the indicated peptic peptides are presented. Error bars represent SEM, * indicated p < 0.05 as analyzed by t-test.
