
Figure 3.
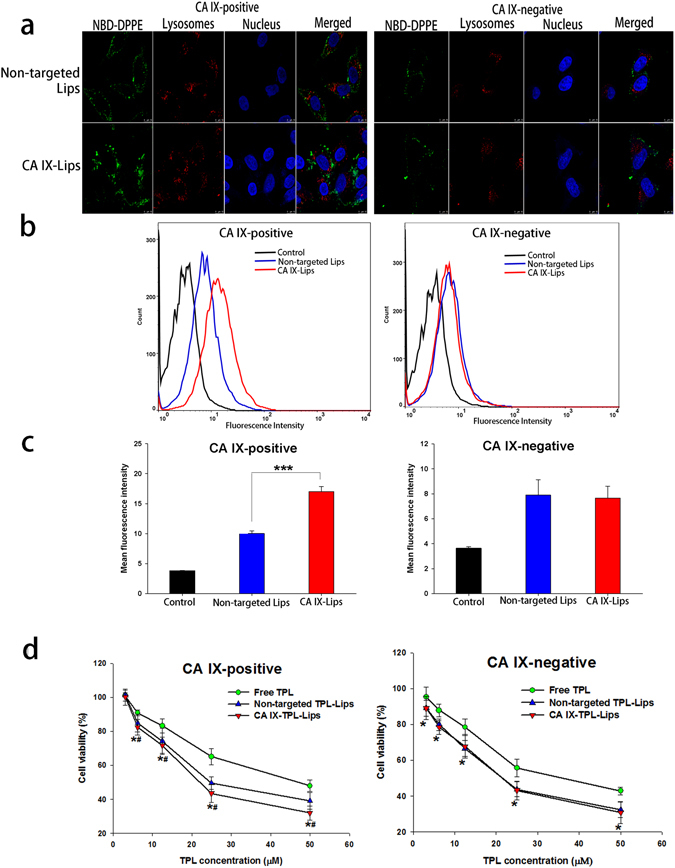
Cellular uptake and cytotoxicity of CA IX-TPL-Lips in NSCLC A549 cells. (a) Confocal laser scanning microscopy image of CA IX-negative and CA IX-positive A549 cells after treatment with NBD-DPPE labeled CA IX-Lips and non-targeted liposomes for 4 h; Scale bars, 10 μm. (b) Quantitative analysis of NBD-DPPE-labeled liposomes uptake by flow cytometry. (c) Mean fluorescence intensity of NBD-DPPE-labeled liposomes after 4 h treatment; control cells were untreated. Data are presented as mean ± SD (n = 3), ***Indicates p < 0.001. (d) In vitro cytotoxicity of free TPL, non-targeted TPL-Lips and CA IX-TPL-Lips against CA IX-positive and CA IX-negative A549 cells assessed by MTT assay. Data are presented as mean ± SD (n = 3). *p < 0.05 compared with free TPL group; #p < 0.05 compared with non-targeted TPL-Lips group.