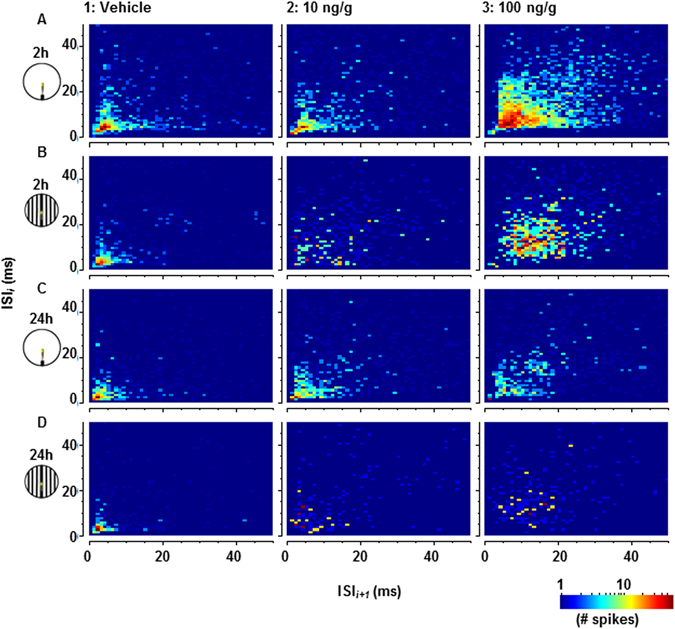
Figure 3.

Joint inter-spike interval (ISI) distribution heatmaps comparing one ISI (y-axis, ms) with the following ISI (x-axis, ms). Heatmaps in column 1 were compiled from 5 stimulus presentations per animal either before treatment (1A,B, n = 25), or 24 hours after treatment with the vehicle (1C,D, n = 10). 2–3A,B were recorded from 80 to 110 minutes after treatment with 10 ng/g (n = 5) or 100 ng/g (n = 20) IMD. 2–3C,D were recorded 24 hours after treatment with 10 ng/g (2C,D, n = 10) and 100 ng/g (3C,D, n = 10).
