Figure 8.

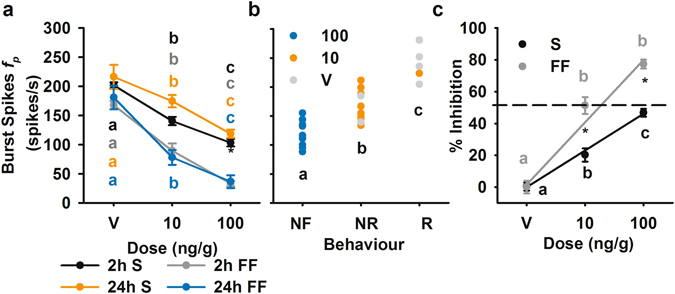
Effect of IMD on burst spike peak firing rate (f p) and correlation with observed behavioural deficits. (a) Burst spike peak f p at 2 and 24 hours after treatment, for stimuli presented against simple (S) and flow field (FF) backgrounds. (b) Burst spike f p correlated with flight behaviour at 24 hours after treatment with IMD or vehicle: NF, not flying; NR, flying but not responding; R, responding with a turn or glide, with a Pearson correlation coefficient of 0.872. Each data point represents measurements from a single animal, and letters denote significant differences between means. (c) Percent inhibition with effects at 2 and 24 hours combined for each background type, plotted as percent reduction from the mean of the vehicle treatment group. Colour coded letters denote significant differences between treatments within each background, and asterisks denote significant differences between S and FF within treatment.
