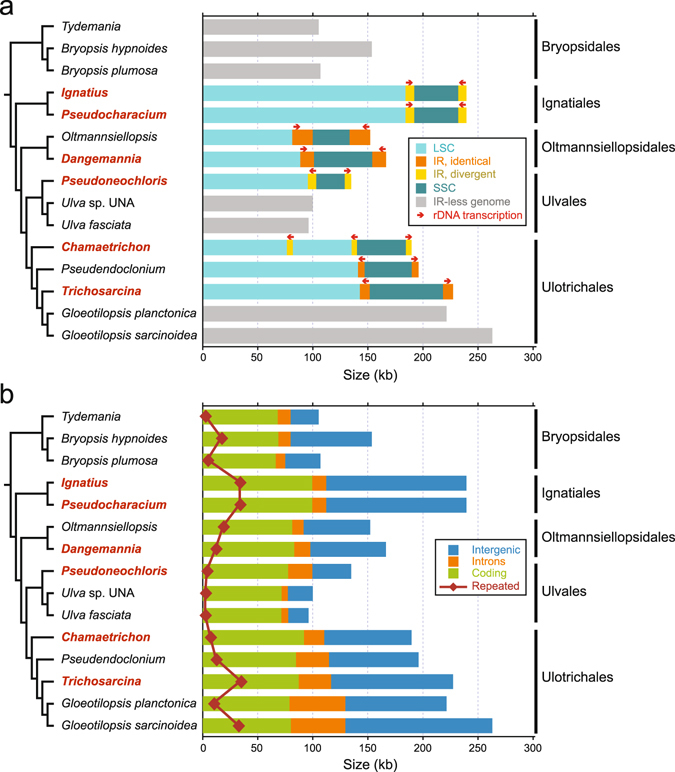
Figure 1.

Sequence coverages in the 15 ulvophycean chloroplast genomes compared in this study. (a) Sizes of the SSC, IR and LSC regions. Red arrows indicate the direction of transcription of the rRNA operon in IR-containing genomes. Genomes lacking the IR are represented in grey. The names of the newly examined taxa are indicated in red. (b) Amounts of coding, intronic, intergenic and small repeated sequences (≥30 bp). Note that intron-encoded genes were not considered as coding sequences but rather as intron sequences. The phylogenetic relationships among the taxa examined are derived from Fig. 2b.
