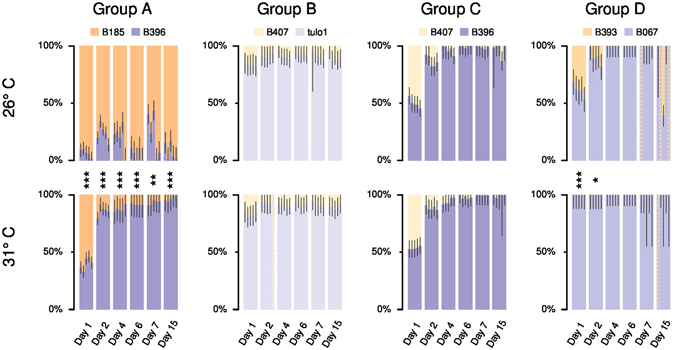
Figure 3.

Genotype proportions estimated by HRM runs after 1, 2, 4, 6, 7 and 15 days of competition in liquid medium. For each day, vertical bars show the relative proportions of each competing genotype in five experimental replicates within each competition group (A, B, C and D) and black lines indicates the 90% confidence interval for each proportion estimate based on the triplicate HRM samples. The ordering of experimental replicates in the bar plots are the same from day 1 to day 15 within each group × temperature treatment. The names of the competing genotypes are indicated on the vertical axes. Hatched bars indicate replicates for which HRM data could not be used to estimate genotype proportions. For each day within each competition group, symbols between the 26 °C and 31 °C bar plots indicate the p-values of a Welch’s t-test comparing the genotype proportions for the 26 °C replicates and for the 31 °C replicates (*** < 0.001 < ** < 0.01 < * < 0.05).
