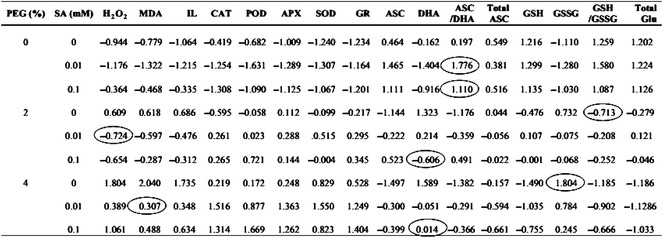
Table 1.
Biochemical targets of SA pretreatment and PEG on Artemisia aucheri by comparing of standard values in each row (marked by circle) based on Z-score of the variables

Circle indicates the maximum difference with the same level of PEG treatment. Positive values indicate data above, and negative values shows data below the average (zero). Data are mean of three replicates
