Fig. 1.

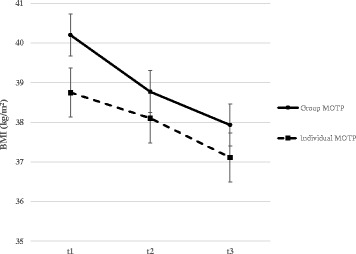
BMI over time by group. Note: The plot shows the average BMI in kg/m2 over time split by group. The vertical bars indicate the standard errors of the mean. In practice, 3 kg weight loss corresponds approximately to 1 unit decrease in BMI

BMI over time by group. Note: The plot shows the average BMI in kg/m2 over time split by group. The vertical bars indicate the standard errors of the mean. In practice, 3 kg weight loss corresponds approximately to 1 unit decrease in BMI