Fig. 1.

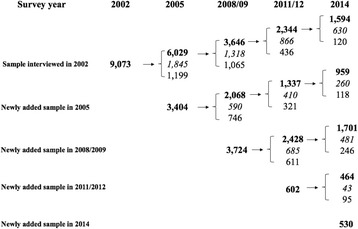
Structure of the study sample. Note: Numbers in bold font indicate survivors at each wave. Numbers in italic font indicate deceased persons. Numbers in normal font indicate respondents who were lost to follow-up

Structure of the study sample. Note: Numbers in bold font indicate survivors at each wave. Numbers in italic font indicate deceased persons. Numbers in normal font indicate respondents who were lost to follow-up