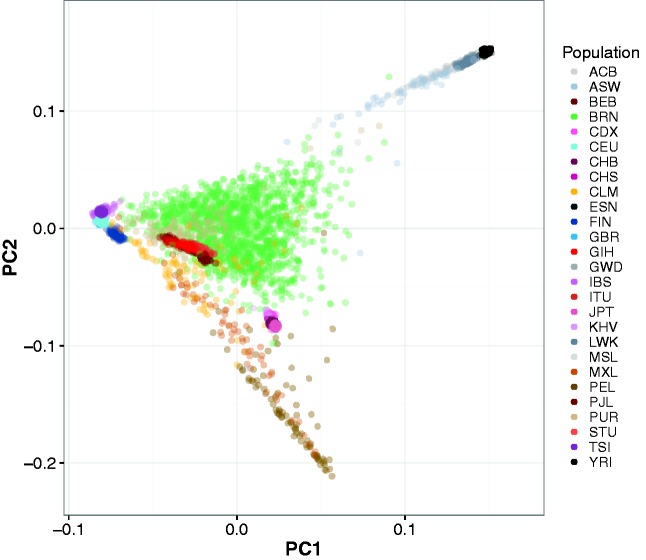
Fig. 2.
Genome-wide principal component analysis of the Brazil samples using all 1000 Genomes as race/ethnic reference samples in the component coordinates. The principal components were solely defined by variation in the Brazil samples (shown in green glyphs, BRN group) and the reference samples plotted into these coordinates. Principal Component 1 (PC1) is plotted against 2 (PC2). The 1000 Genomes population descriptions corresponding to the three letter codes are listed in supplementary table S2, Supplementary Material online. Higher principal components (PC3–15) did not define additional ancestral structure at the granularity of the 1000 Genomes populations. European populations cluster at approx. (PC1, PC2) (−0.08, 0.01), Asian populations at (0.02, −0.08) and Indian subcontinent populations at (−0.03, −0.02). African populations and Amerindian populations cluster along the two axes projecting from Europe at the top and bottom of the plot.

