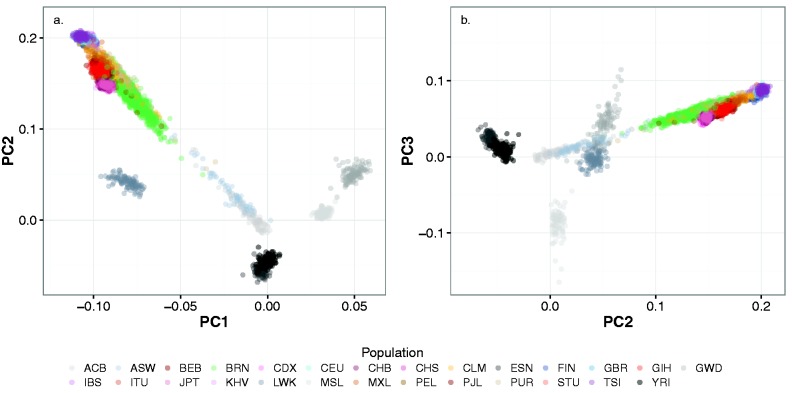
Fig. 3.
Genome-wide, Africa-centric, principal component analysis of the Brazil and 1000 Genomes samples. The sample three letter and color codes are identical to figure 1. Genetic variation within the African 1000 Genomes populations (ESN, GWD, LWK, MSL, and YRI), defined (supervised) the principal components with other samples plotted onto these coordinates. Panel a shows PC1 vs. PC2 and panel b shows PC2 vs. PC3. Principal components higher than three reflected recent kinship within a 1000 Genomes African population, rather than ancestral population structure. Approximate coordinates of the supervising 1000 Genomes African clusters are (PC1, PC2): YRI/ESN (0.0, −0.05); MSL (0.03, 0.001); GWD (0.05, 0.05); LWK −0.075, 0.04). Nonsupervising samples with majority African ancestry include the more “smeared” (admixed) and less homogeneous ACB (−0.02, 0.0); and ASW (−0.02, 0.02). PC3 segregates the MSL population (−ve PC3 coordinate).

