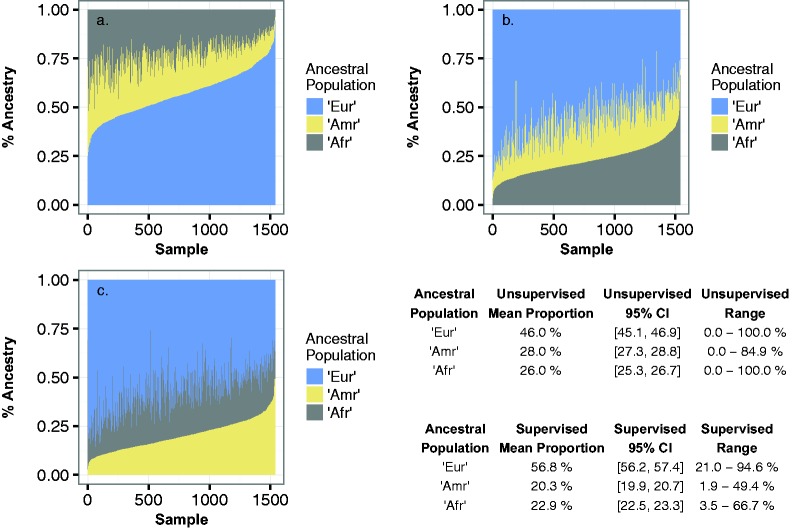
Fig. 4.
The proportion of continental ancestry within the Brazil samples, estimated using supervised ADMIXTURE analysis. The K = 3 ancestral components are labeled “Eur” predominantly European; “Amr” predominantly Amerindian; “Afr” predominantly African. In each panel, each individual sample along the x-axis is a narrow vertical bar with three color intervals along the y-axis that are proportional to the percentage of the three ancestries and sum to 100% (y = 1.0). In panel a, the Brazil samples are sorted along the x-axis from lowest to highest fraction of Eur ancestry (blue); in panel b, sorted by fraction of African ancestry (grey); in panel c, by fraction of Amerindian ancestry (yellow). The table shows the mean proportion of each ancestry with 95% confidence interval, and range.

