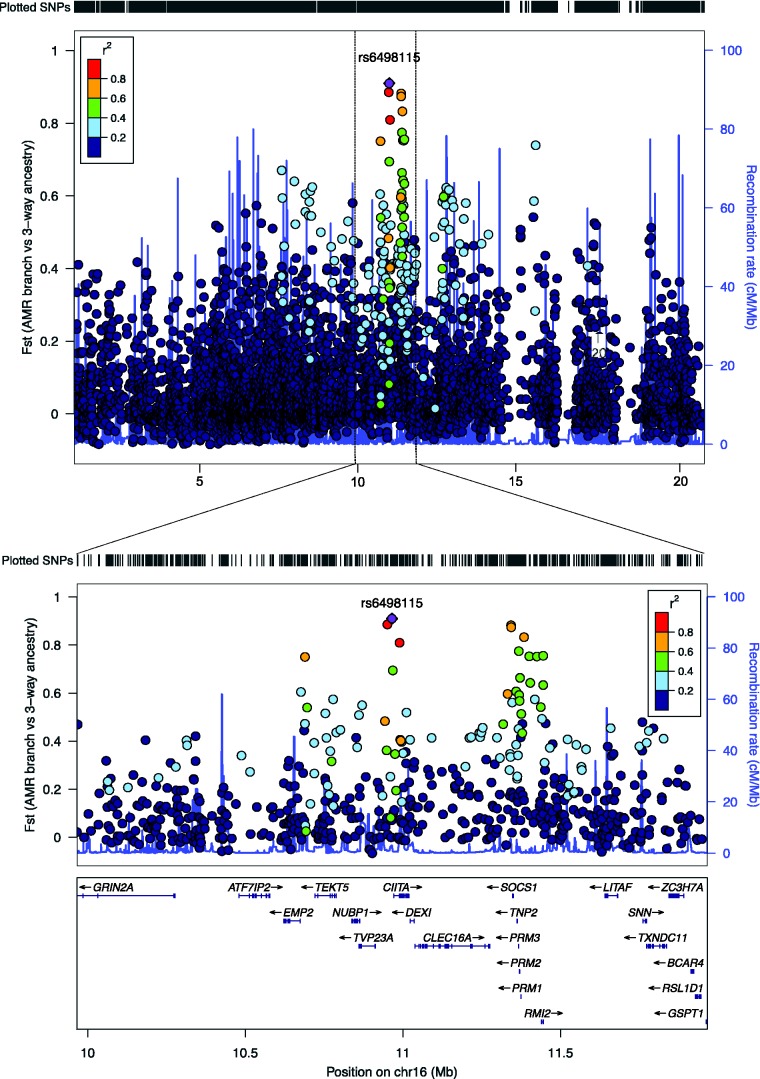
Fig. 5.
Genome regional plots of the most highly differentiated region along the Amerindian branch, centered on SNP rs6498115, chromosome 16. The plots were generated using LocusZoom and show the physical region of chromosome 16, 0.9–20.9 Mb and at higher resolution, 9.9–11.9 Mb. The linkage disequilibrium between SNPs was estimated in LocusZoom using the 1000 genomes admixed American samples (AMR).

