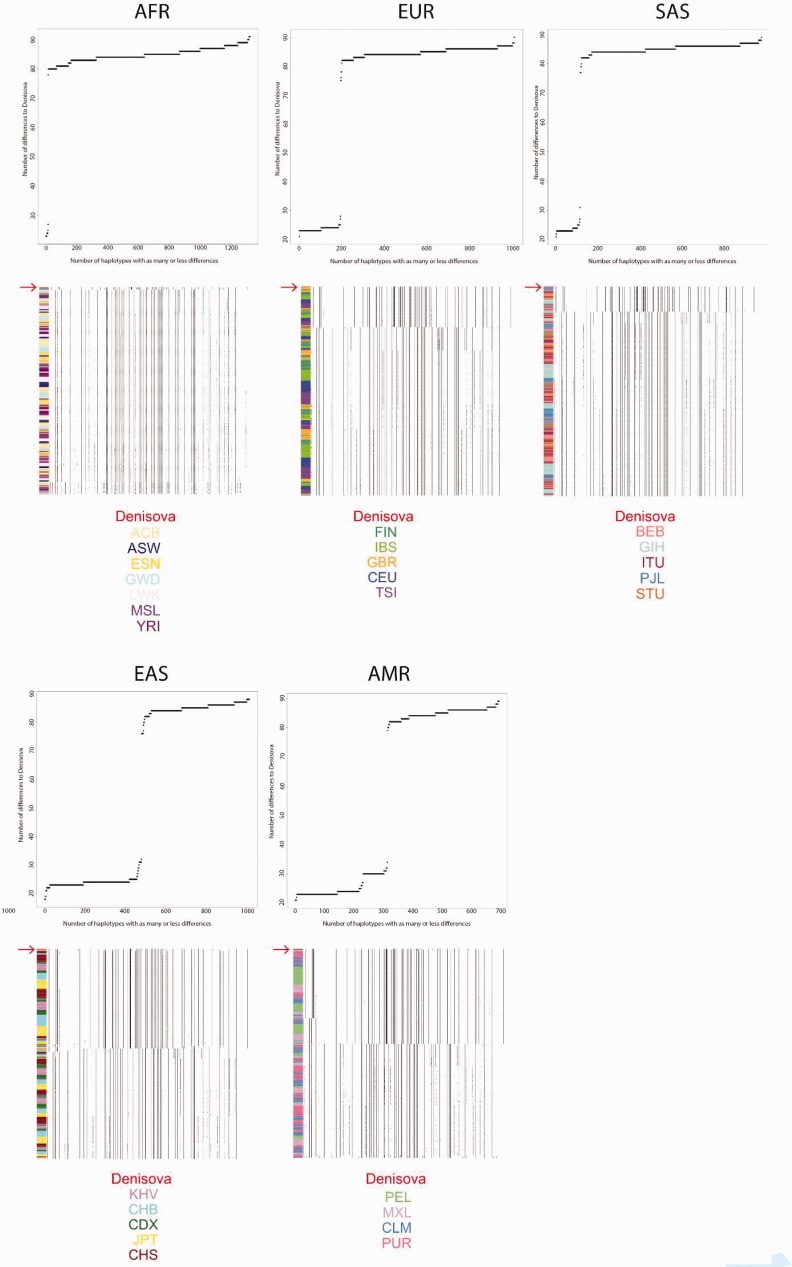
Fig. 4.
We counted the differences between the Denisovan genome and all haplotypes in each 1,000G continental panel (AFR, EUR, SAS, EAS, and AMR). For each panel, we plot the cumulative number of haplotypes that have as many or less differences to the Denisovan genome than specified in the x-axis. Below each of these plots, we also plot the haplotype structure for each 1,000G panel in the introgressed tract, ordering haplotypes by decreasing similarity to the Denisovan genome (red arrow, at the top of each panel). The color codes at the bottom refer to 1,000G sub-populations to which the different haplotypes belong, as indicated by the colors in the left column in each panel.

