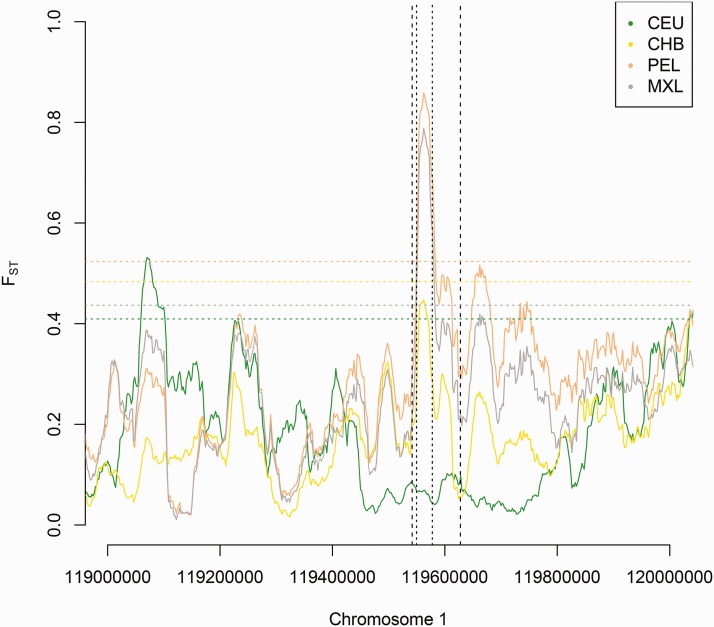
Fig. 5.
We computed FST in different non-African populations (CEU, CHB, PEL, MXL) against African Yoruba (YRI) in the TBX15/WARS2 region. We find a significant (P < 0.01) local increase in FST in American populations (PEL, MXL) exactly where the introgressed haplotype is inferred to be (CRF-tract: vertical dashed lines, HMM-tract: vertical dotted lines). In contrast, we found no significant increase in FST when comparing Europeans (CEU) and East Asians (CHB) against YRI (although there is an observable but non-significant peak in CHB). 99th percentile values of the FST empirical distribution for all comparisons are represented as horizontal dotted lines and color-coded according to the corresponding population.

