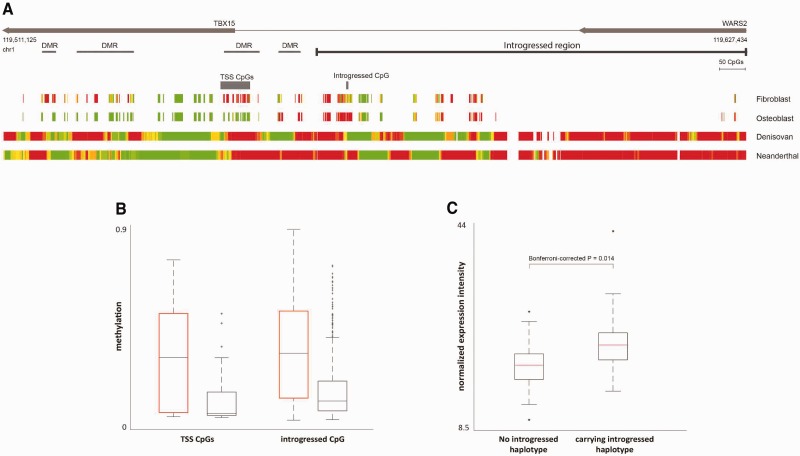
Fig. 7.
The regulatory effects of the introgressed haplotype on TBX15 and WARS2. (A) Methylation maps of the introgressed tract and its downstream region. The bottom panels show the reconstructed methylation maps of the Denisovan and the Neanderthal genomes, as well as two modern methylation maps from osteoblasts and fibroblasts. The maps are color coded from green (unmethylated) to red (methylated). The modern maps include fewer positions as they were produced using a reduced representation bisulfite sequencing (RRBS) protocol. Above the methylation maps are the CpG positions whose methylation levels are significantly associated with the introgressed haplotype. The top panels show TBX15 and WARS2, the introgressed tract (as defined by the CRF), and the previously identified DMRs, where the Denisovan genome differs from present-day humans. (B) Individuals carrying the introgressed haplotype (marked by black boxes) show lower levels of DNA methylation in both regions, compared with individuals who do not carry the introgressed haplotype (marked by orange boxes), in both the 16-CpG region around the TSS of TBX15 (left), and a CpG position within the introgressed region (right). (C) Expression of TBX15 in individuals carrying the introgressed haplotype versus individuals who do not carry it. TBX15 is expressed on average at 22% higher levels in individuals carrying the haplotype. Analogous boxplots but partitioned by genotype rather than presence/absence of haplotype are shown in figure S14.

