
Figure 8.
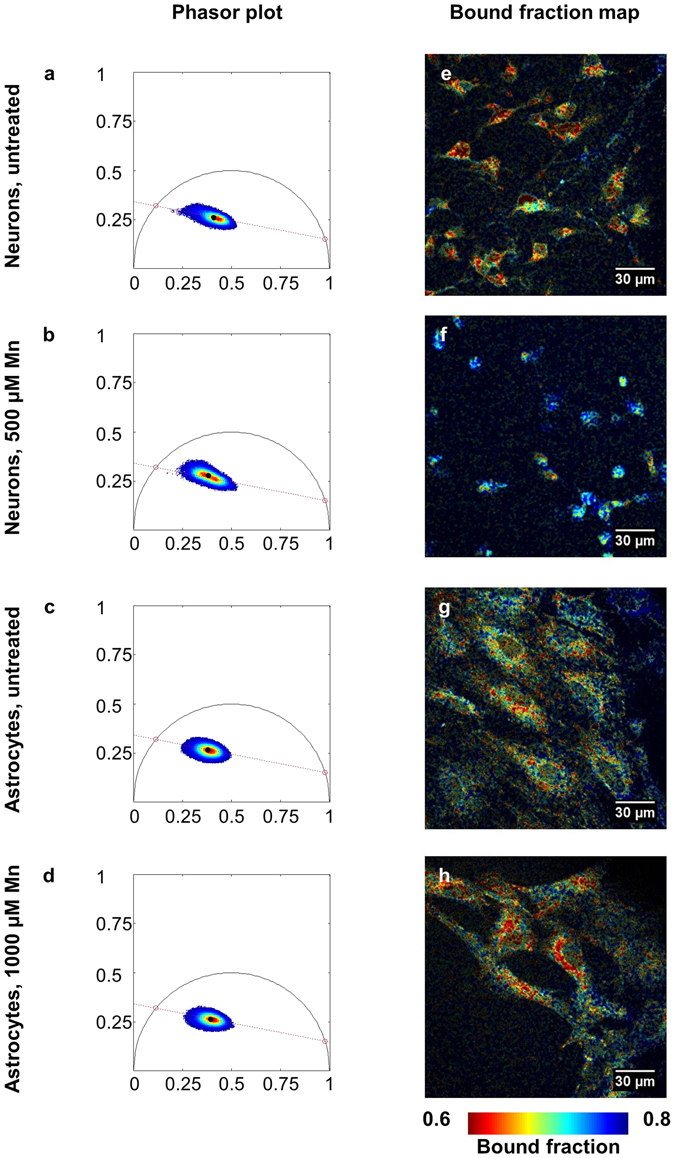
Phasor analysis of NAD(P)H fluorescence lifetime. (a–d) Phasor plots of neurons and astrocytes with and without Mn plotted along a standard curve intersecting 5.5 ns and 0.31 ns. (a,b) Neurons treated with Mn (b) have a phasor distribution shifted towards bound NAD(P)H relative to the control (a). (c,d) Astrocytes treated with Mn (d) have a phasor distribution shifted towards free NAD(P)H relative to the control (c). (e–h) These shifts are echoed in bound fraction maps formed from a representative image from each group.