
Figure 2.
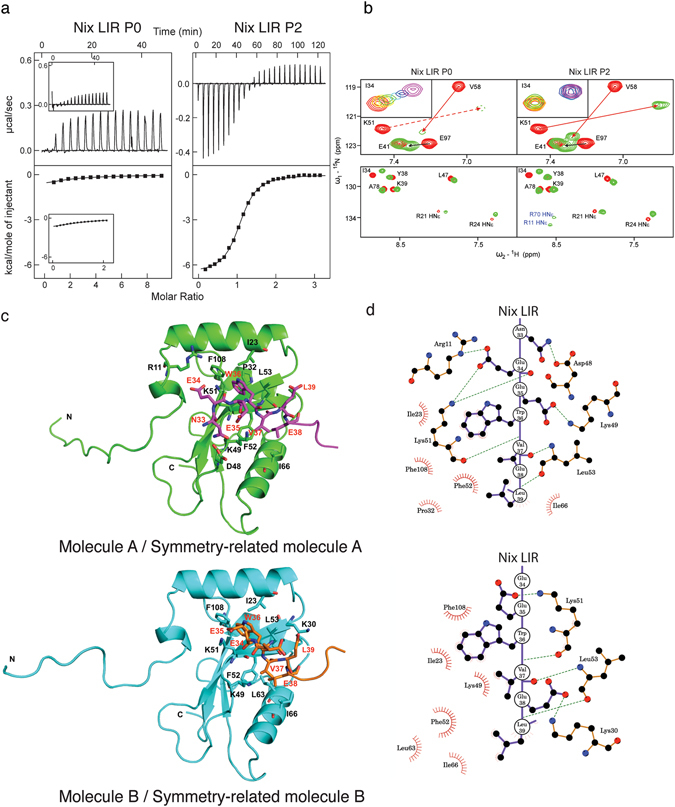
Influence of Nix phosphorylation on its interaction with LC3B studied by ITC, NMR and crystallography. (a) ITC profiles for the titration of Nix LIR P0 (left) and Nix LIR P2 (right) peptides into LC3B are shown at the main plots in the same scales of energy. For comparison, ITC data from Novak et al.17, representing LC3B titration with P0, are shown in the small windows within corresponding plot. In each plot the top diagram displays the raw measurements and the bottom diagram shows the integrated heat per titration step. (b) Upper plots: Representative sections (“fingerprint area”) of 15N-labeled LC3B [15N,1H]-TROSY HSQC spectra in the free LC3B state (red contours) and in complex with Nix LIR P0 and P2 peptides (green contours). Arrows show direction of CSP for selected residues. Dashed lines represent CSP of the K51 HN resonance, which cannot be visualized at this experimental series. Small windows within the plots represent exchange modes for the characteristic LC3B residues Ile34 upon P0 and P2 peptides titrations (rainbow color-code). Low plots: Representative spectral section showing arginine HNε side-chain resonances. They are aliased in the ω1 dimension and appear at a 15N chemical shift 50 ppm downfield from their true position. Tentative assignment for the HNε side-chain resonances appeared upon P2 titration is given in blue. (c) Structure of Nix/LC3B complex. Structures of Nix-LIRS34,35E-LC3B2–119 molecules A and B are represented by ribbon diagrams and colored in green (molecule A) and cyan (molecule B). Nix LIR portions in symmetry-related molecules (molecule A, magenta; molecule B, orange) and its interacting residues are shown in stick representation. Oxygen, nitrogen and sulfur atoms are shown in red, blue and yellow, respectively. Schematic representations showing the interaction between LC3B and Nix LIRS34,35E on level of residues were generated by LIGPLOT35.