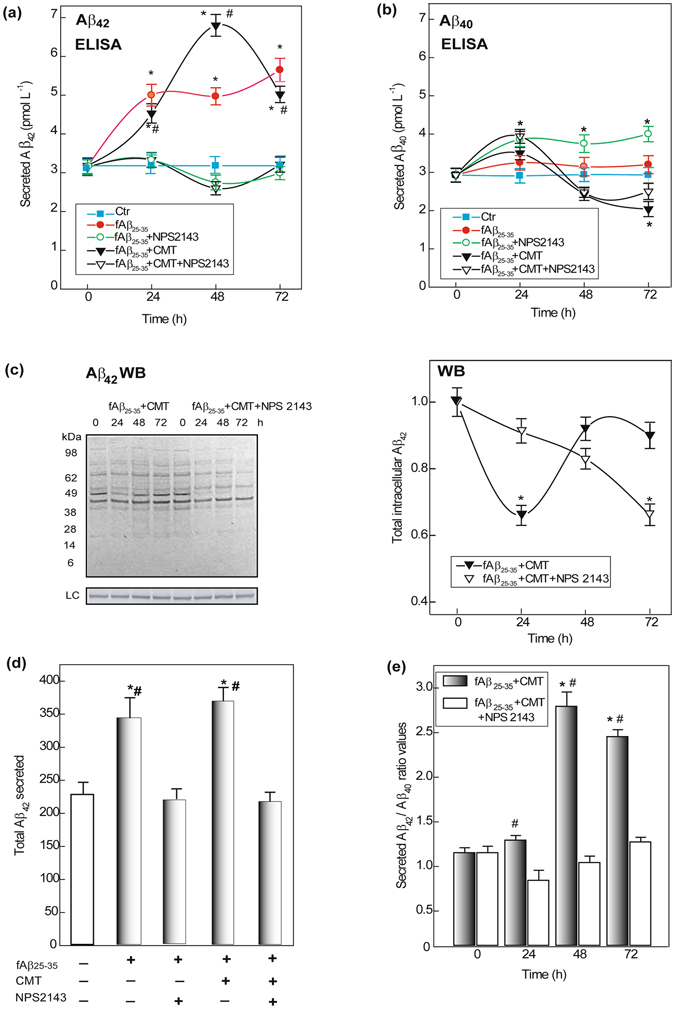
Figure 1.

Changes in human astrocytes’ secreted and intracellular amounts of endogenous Aβ42 and Aβ40. (a) Aβ42 peptides secreted amounts increase after an exposure to fAβ25 −35 ± CMT, but stay unchanged when NPS 2143 is also added. Points on the curves are means ± SEM of 3–5 independent experiments; fAβ25–35 + CMT ± NPS 2143: one-way ANOVA analysis of the complete data set F = 140.805, P < 0.001. Bonferroni t-test: comparisons of each treated group versus 0-h group (controls): *P < 0.05; pair-wise comparisons between corresponding treatments ± NPS 2143 at each time point: #P < 0.05. (b) Changes in Aβ40 released amounts according to the treatments. Points on the curves are means ± SEM of 3–5 independent experiments; fAβ25–35 + CMT ± NPS2143: one-way ANOVA analysis of the complete data set F = 13.871, P < 0.001. Bonferroni t-test: comparisons of each treated group versus 0-h group (controls): *P < 0.05. (c) Left panel. Typical immunoblot revealing the changes in intracellularly accumulated Aβ42/Aβ42-os versus untreated controls according to treatments. LC, loading control. Right panel. Densitometric evaluations of the whole sets of intracellular Aβ42 bands at each time point. Points on the curves are means ± SEM of 3 independent experiments, with control values normalized as 1.0. One-way ANOVA analysis of the complete data set F = 3.933, P < 0.012. Bonferroni t-test: comparisons of each treated group versus 0-h group (controls): *P < 0.05. (d) Alterations in total 0-to-72-h amounts of secreted Aβ42 according to treatments. Bars are means ± SEM of 5 independent experiments. One-way ANOVA analysis of the complete data set F = 13.248, P < 0.001. Bonferroni t-test: comparisons of each treated group versus 0-h group (controls): *P < 0.05; pair-wise comparisons between corresponding treatments ± NPS 2143: #P < 0.05. (e) Changes in secreted Aβ42/Aβ40 ratio values according to treatments in the conditioned growth media of astrocytes. Bars are means ± SEM of 3 independent experiments. One-way ANOVA analysis of the complete data set F = 73.769, P < 0.001; Bonferroni t-test: comparisons of each treated group versus 0-h group (controls): *P < 0.05; pair-wise comparisons between corresponding treatments ± NPS 2143 at each time point: #P < 0.05.
