
Figure 2.
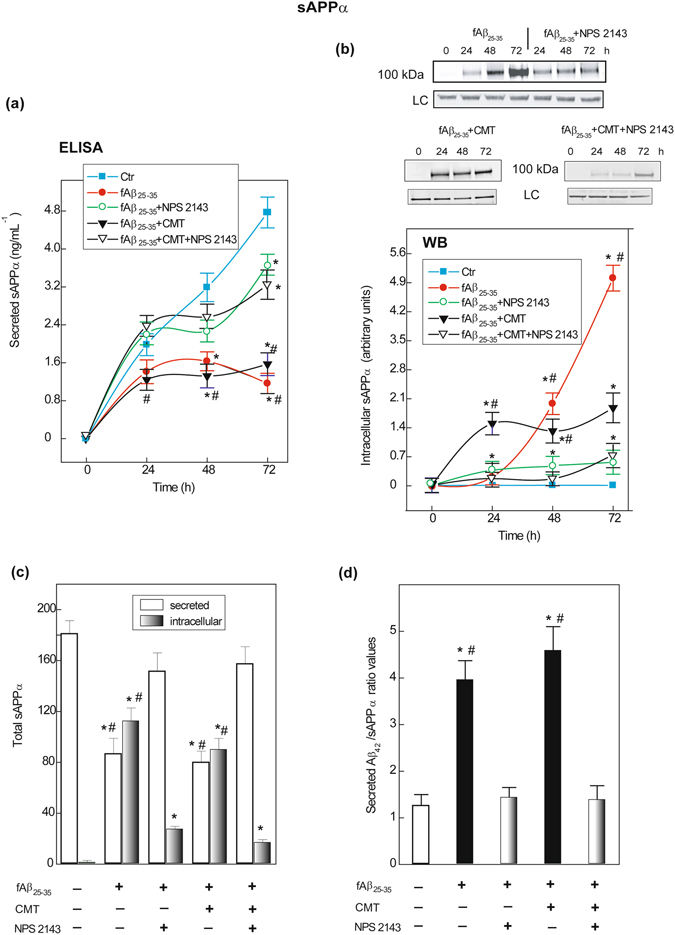
Changes in human astrocytes intracellularly accumulated and extracellularly shed amounts of sAPPα according to treatments. (a) Cumulative curves of sAPPα shed into the medium by astrocytes as affected by treatments. Points on the curves are means ± SEM of 5 independent experiments. One-way ANOVA analysis of each complete data set: fAβ25–35: F = 80.877, P < 0.001; fAβ25–35 + NPS 2143: F = 35.365, P < 0.001; fAβ25–35 + CMT: F = 50.882, P < 0.001; fAβ25–35 + CMT + NPS 2143: F = 34.261, P < 0.001. Bonferroni t-test: comparisons of each treated group versus 0-h group (controls): *P < 0.05; pair-wise comparisons between corresponding treatments ± NPS 2143 at each time point: #P < 0.05. (b) Top. Typical immunoblot revealing the changes in intracellularly accumulated sAPPα according to treatments versus controls (0-h). LC, loading control. Blots have been cropped to size for clarity. Bottom. Densitometric evaluations of intracellular sAPPα bands. Points on the curves are means ± SEM of 3 independent experiments, with 0-h values normalized as 1.0. One-way ANOVA analysis of each complete data set: fAβ25–35 ± NPS 2143: F = 280.483, P < 0.001; fAβ25–35 + CMT ± NPS2143: F = 134.239, P < 0.001. Bonferroni t-test: comparisons of each treated group versus 0-h group (controls): *P < 0.05; pair-wise comparisons between corresponding treatments ± NPS 2143 at each time point: #P < 0.05. (c) The alterations in total 0-to-72-h amounts of extracellularly shed and intracellular sAPPα according to treatments or no treatment (controls). Bars are means ± SEM of 3–5 independent experiments. One-way ANOVA analysis of the (i) shed sAPPα complete data set: F = 44.056, P < 0.001; (ii) intracellular sAPPα complete data set: F = 587.435, P < 0.001. Bonferroni t-test: comparisons of each treated group versus untreated group (controls): *P < 0.05; pair-wise comparisons between corresponding treatments ± NPS 2143 of both intracellular and shed values, respectively: #P < 0.05. (d) Changes in secreted Aβ42/sAPPα ratio values according to treatments or no treatment (controls). Bars are means ± SEM of 5 separate experiments. One-way ANOVA analysis of the complete data set F = 22.123, P < 0.001. Bonferroni t-test: comparisons of each treated group versus 0-h (controls): *P < 0.05; pair-wise comparisons between corresponding treated group versus added NPS 2143 group: #P < 0.05.