
Figure 4.
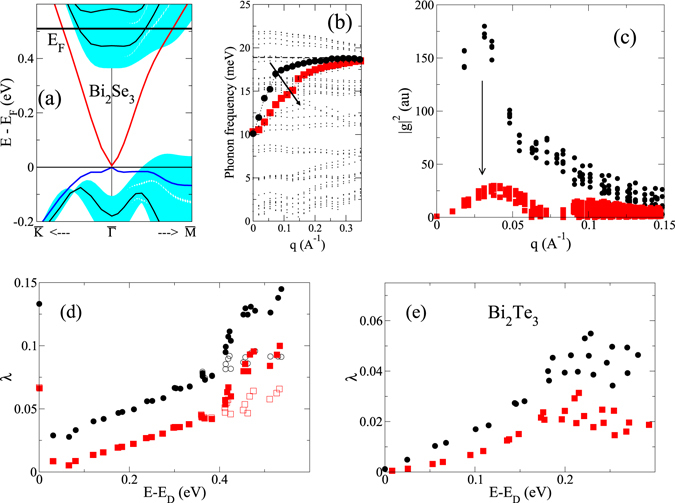
(a–d) Changes of EPI under doping for Bi2Se3 (3QL). (a) Bandstructure indicating position of Fermi level. (b) Phonon dispersion along the direction. Large, filled squares highlight the in-plane polar-type branch. The dispersion for low doping (see Fig. 1) is shown by the black circles for comparison. The arrow indicates the enhanced screening effect on this mode. (c) Squared electron-phonon matrix elements, |g|2, as function of the momentum transfer q. Red squares correspond to heavy doping, black circles to the slightly doped case, respectively. (d) Coupling constants for the upper part of the Dirac cone comparing the two dopings (read squares: large doping; black circles: low doping). (e) Coupling constants for a 4QL slab of Bi2Te3 comparing undoped (black circles) and the heavily doped case (red squares).