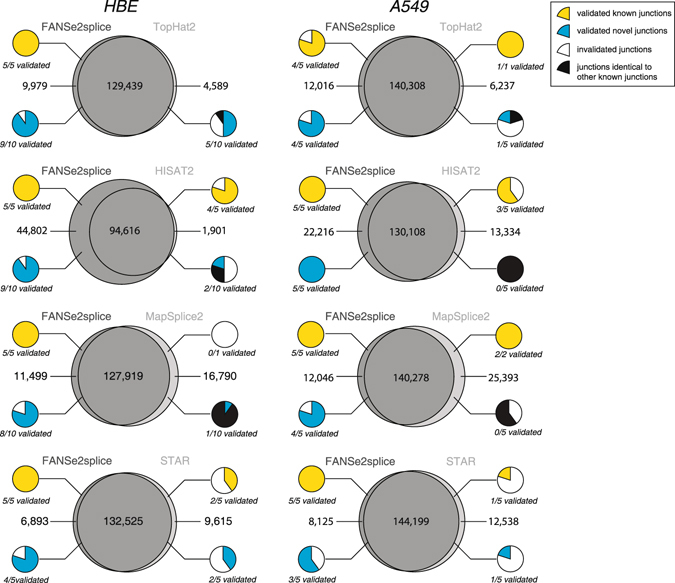
Figure 4.

RT-PCR validation of the splice junctions solely detected by one algorithm using bulk mRNA. Comparison of the splice junctions detected by FANSe2splice versus TopHat2, HISAT2, MapSplice2 and STAR, for HBE and A549 cell lines, respectively. The junctions solely detected by one algorithm were tested by RT-PCR. Small pie charts denote the fraction of validated known junctions (yellow) and novel junctions (cyan). The junctions identical to other known junctions were marked as black. Complete experimental evidences for all RT-PCR validations are listed in Supplementary Figs S3–S6. Please see main text for more details.
