Figure 5.

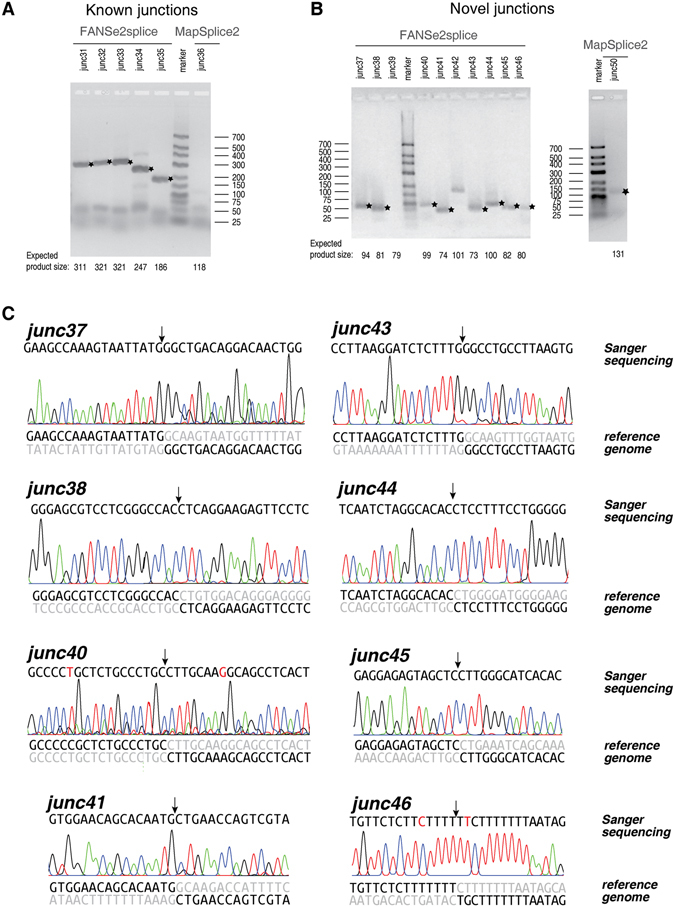
Detailed RT-PCR and Sanger sequencing results of splice junctions solely detected by FANSe2splice versus MapSplice2. (A,B) RT-PCR validation of the FANSe2splice and MapSplice2 solely detected junctions in HBE, as an example: (A) for known junctions and (B) for novel junctions. The bands with the expected product sizes were marked with stars. (C) Sanger sequencing validation of all 8 novel junctions solely detected by FANSe2splice in (B) panel. The arrows indicated the splice site. The exon sequences in the reference genome were shown in black, and the intron sequences were shown in grey. SNPs are marked as red in the sanger sequencing results.
