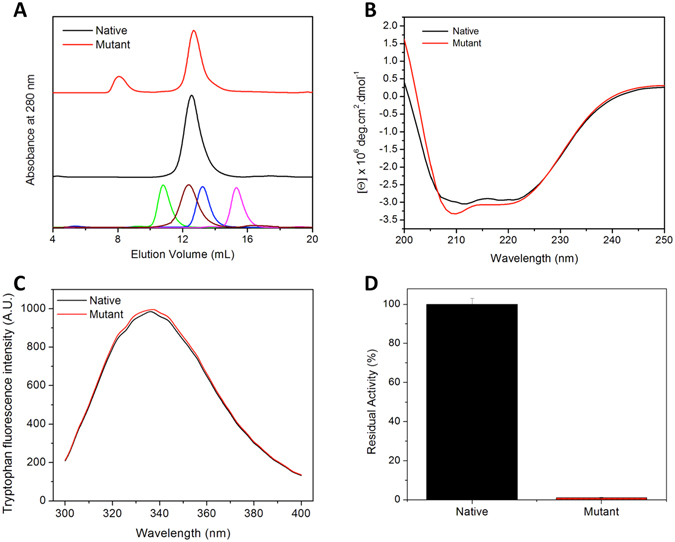
Figure 2.

Comparative biochemical profiles of native and mutant MtbICL. (A) Size exclusion chromatography profiles. Lowest panel shows chromatogram of known standard molecular weight markers- ferritin (440 kDa at 10.8 mL, in green), catalase (232 kDa at 12.4 mL, in brown), aldolase (158 kDa at 13.2 mL, in blue) and ovalbumin (43 kDa at 15.3 mL, in pink). (B) Far-UV CD spectra, (C) Intrinsic tryptophan fluorescence emission curves and (D) Percent residual enzymatic activity.
