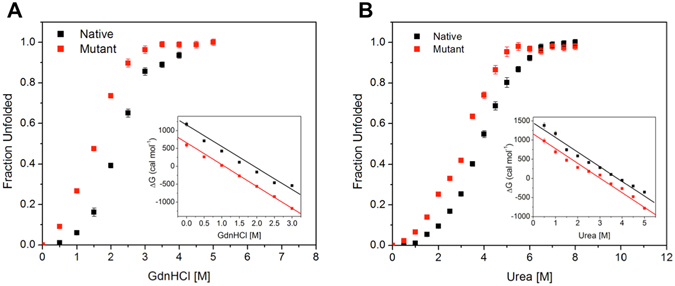
Figure 3.

Determination of free energy of stabilization. Plot of fractional change in the wavelength maxima of the intrinsic tryptophan fluorescence of the native (black square) and mutant (red square) MtbICL with increasing concentration of (A) Urea and (B) GdnHCl. In both the figures, inset shows the linear free energy extrapolation curve of native (black square) and mutant (red square) MtbICL with respect to [Urea] and [GdnHCl] respectively. The ∆GH20 was the intercept on the Y-axis, obtained using the linear extrapolation method.
