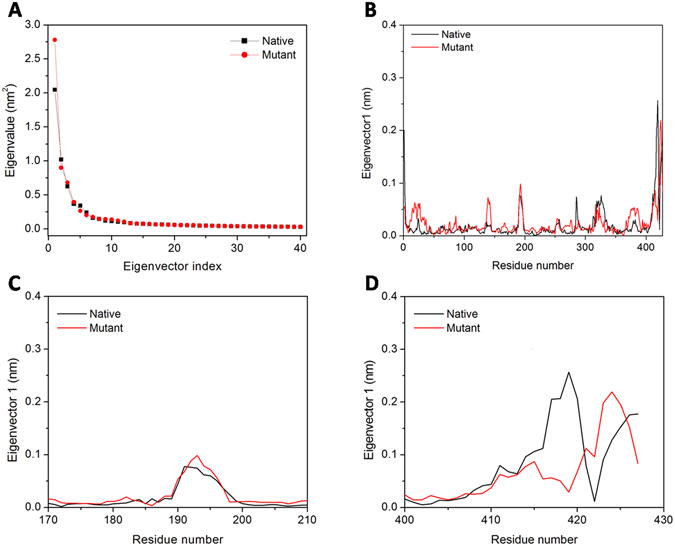
Figure 7.

Principal component analysis. (A) The eigenvalues plotted against the corresponding eigenvector indices obtained from the Cα covariance matrix constructed from the last 30 ns of the MD trajectory. First 40 eigenvectors were used for calculations. (B, C and D) represents the displacements of the components of the chain A, active site region (residues 170–210) and C-terminal region (residues 400–427) of the native with mutant MtbICL respectively for the PC1.
