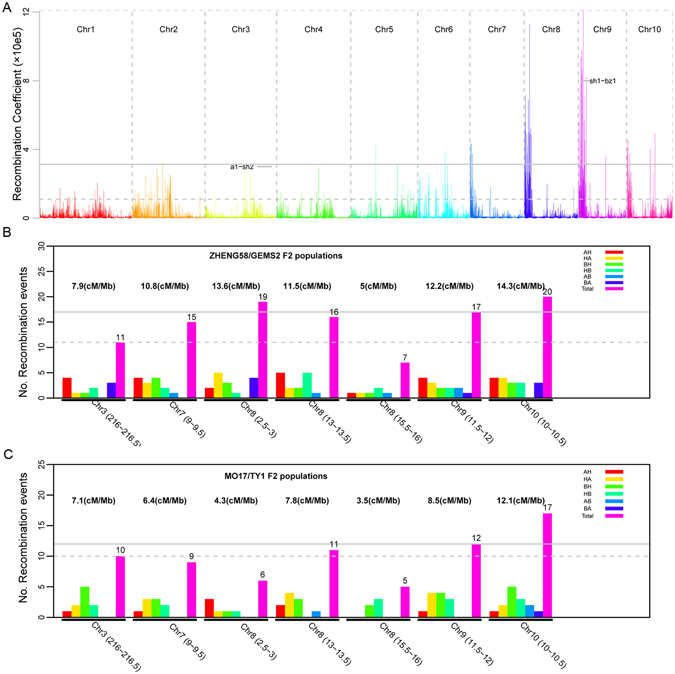
Figure 4.

Distribution and validation of novel recombination hot spots in maize. (A) Distribution of recombination coefficient indicated a large number of recombination hot spots across the maize genome. Two putative recombination hot spots of a1-sh2 and sh1-bz1 were labelled. The gray solid line is the threshold for top 1% recombination coefficients. The Gray dashed line is the threshold line for top 5% recombination coefficients. (B) and (C) High-density genotypeing validation of five randomly selected recombination hot spots in two F2 populations - ZHENG/GEMS2 and Mo17/TY1. A, B, and H in (B) and (C) graphs represent the genotypes of parent 1, parent 2, and heterozygosity, respectively. The number of crossover was obtained by counting the number of individuals with genotype switching in the target recombination region. For example, AH means there was a genotype switch from parent 1 to heterozygosity. The gray solid line shows the recombination rate at the sh1-bz1 locus, while Grey dashed line shows the recombination rate of the a1-sh2 locus.
